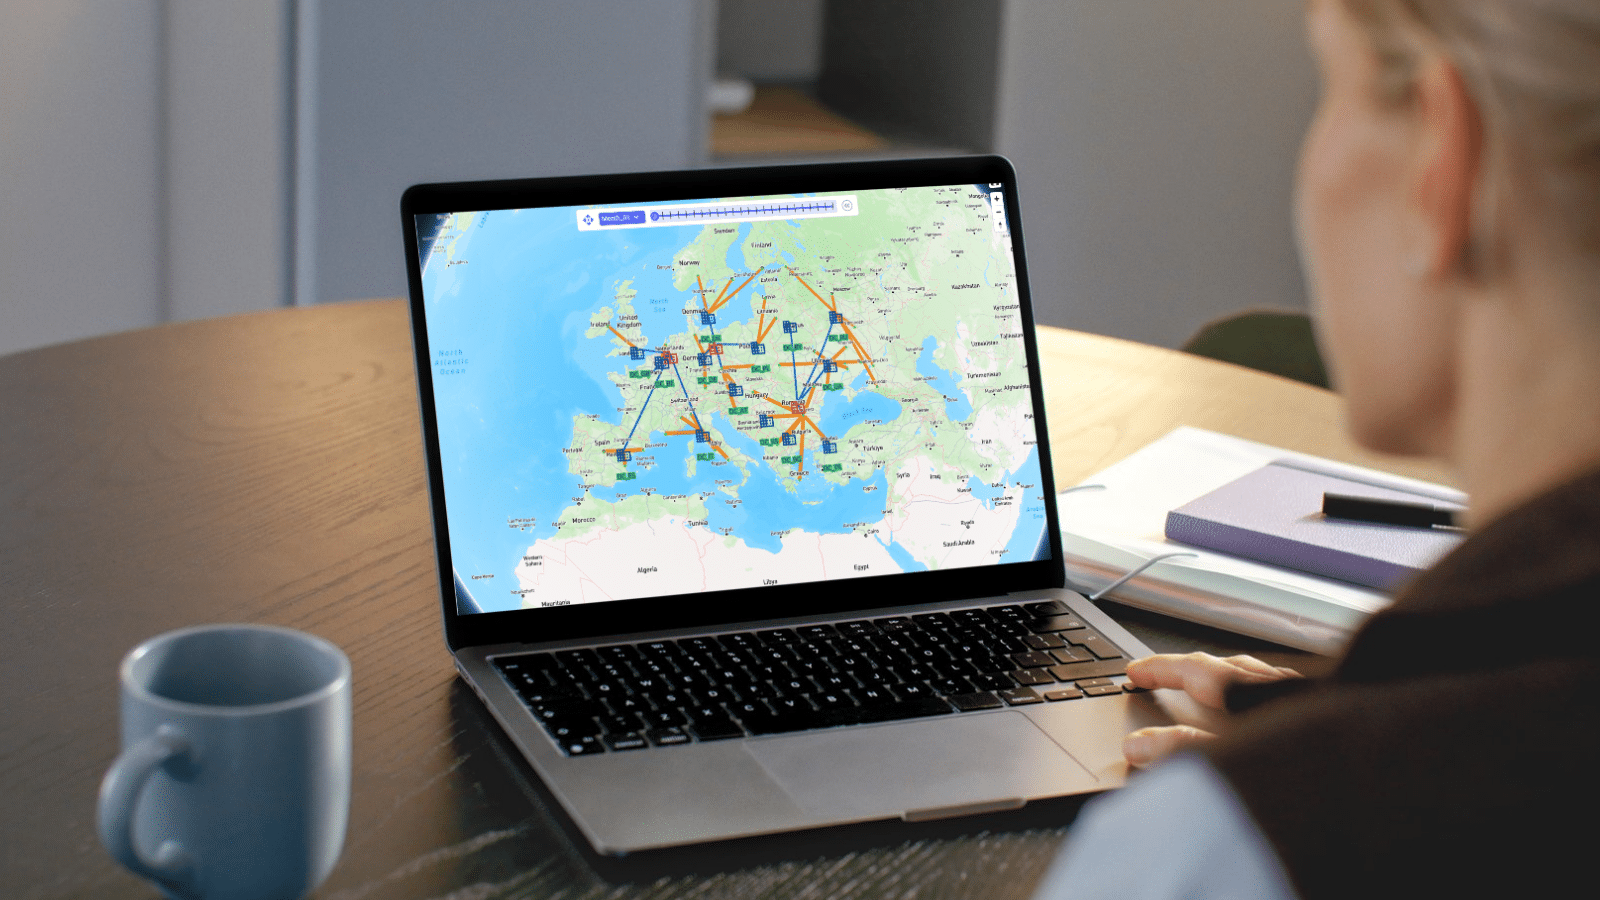

Cyclo is Optilogic’s new Multi Echelon Inventory Optimization (MEIO) engine within Cosmic Frog. It helps supply chain teams determine where safety stock should be held across a network, how much is needed at each stage, and how service levels impact total safety stock cost and responsiveness.
This video gives a quick overview of how to use Cyclo; it uses the Demo Model described further down in this documentation:
If you just want to get going with Cyclo as quick as possible, follow these steps:
Multi Echelon Inventory Optimization (MEIO) is a planning approach used to optimize safety stock across an entire supply chain network.
Cyclo, the MEIO engine, is designed to optimize safety stock placement across multi-stage supply chains that may include suppliers, manufacturing plants, distribution centers, and customer-facing locations. Instead of optimizing each node independently, Cyclo evaluates the entire network simultaneously so organizations can reduce total safety stock while maintaining desired service levels.
Cyclo uses a Guaranteed Service Model (GSM) approach to optimize service-time relationships between facilities and derive recommended safety stock levels.
Cyclo helps organizations answer key supply chain questions such as:
By optimizing safety stock placement across the entire network, Cyclo can help organizations:
Cyclo is especially valuable for:
Both Cyclo and Dendro support inventory optimization workflows in Cosmic Frog, but they are designed for different planning problems.
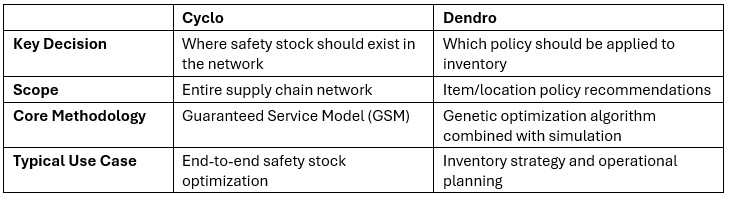
In practice both can be used together:
Cyclo uses a Guaranteed Service Model (GSM) approach. Rather than directly optimizing safety stock quantities, Cyclo optimizes service-time commitments between facilities. Those service-time decisions are then translated into safety stock requirements.
Represents your risk tolerance – balancing the cost of holding extra buffer inventory against the risk and cost of lost sales. This is a user input. Two risk measures are available:
Service Type 1 is a stricter measure than Type 2 and will in most cases lead to more safety stock.
Time a facility expects upstream suppliers to deliver material. This is a decision variable in the optimization
Time a facility needs to replenish – typically transport time from the upstream location to the facility and/or production/processing time at the facility. These are model inputs.
Time a facility promises to deliver to downstream customers. This is a decision variable in the optimization.
The effective time window over which demand uncertainty accumulates.
In a Guaranteed Service Model (GSM), each facility commits to serving downstream nodes within a defined service time. The effective exposure to uncertainty is the Net Replenishment Time (NRT):
NRT = Incoming Service Time + Fixed Lead Times − Outgoing Service Time
As NRT increases, more uncertainty accumulates and more safety stock is typically required.
Cyclo evaluates many combinations of incoming and outgoing service times across the network to find the lowest total safety stock holding cost, while reaching the target service level. The optimization is not changing any fixed lead times. Instead, it is strategically deciding where responsiveness should exist in the network.
Consider a product with the following flow path:
Manufacturer → Distribution Center → Customer
Assume the following fixed lead times:
The total physical replenishment lead time across the network is therefore 5 days.
These lead times are inputs to the model and are not optimized. What Cyclo optimizes are the service-time commitments between stages. Specifically:
These service times are optimized with the goal to minimize total safety stock holding cost across the network.
In the next example scenarios:
Manufacturer ----> DC (5 days safety stock) ----> Customer

Interpretation:
This approach is common in highly responsive distribution networks.
Manufacturer (2 days safety stock) --> DC (3 days safety stock) --> Customer

Interpretation:
Manufacturer (4 days safety stock) --> DC (1 day safety stock) --> Customer
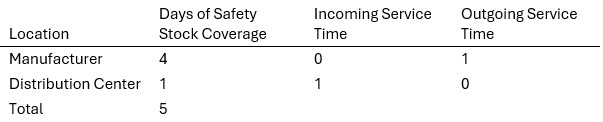
Interpretation:
The total physical replenishment exposure is driven by the same 5-day total network lead time in all 3 scenarios.
What changes is:
Cyclo evaluates many combinations of:
to determine the optimal inventory strategy across the network.
Without MEIO, organizations often duplicate safety stock across multiple locations and optimize inventory independently at each node. Cyclo instead evaluates the network holistically and strategically concentrates inventory where it is most cost-effective, while achieving the required service level.
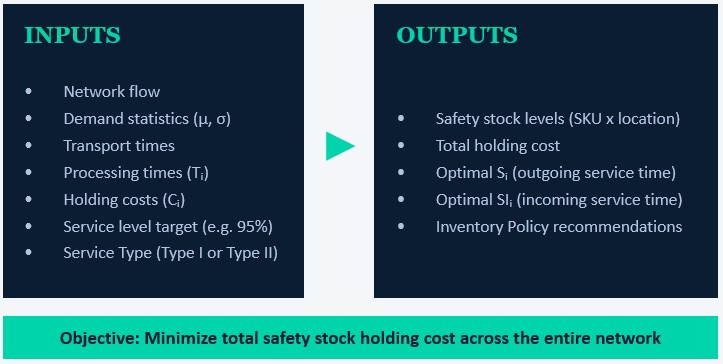
The following diagram summarizes the inputs and outputs of the Cyclo engine; they will be covered in more detail in the Cyclo in Cosmic Frog section that follows.
The following workflow provides a step-by-step approach for configuring and running Cyclo.

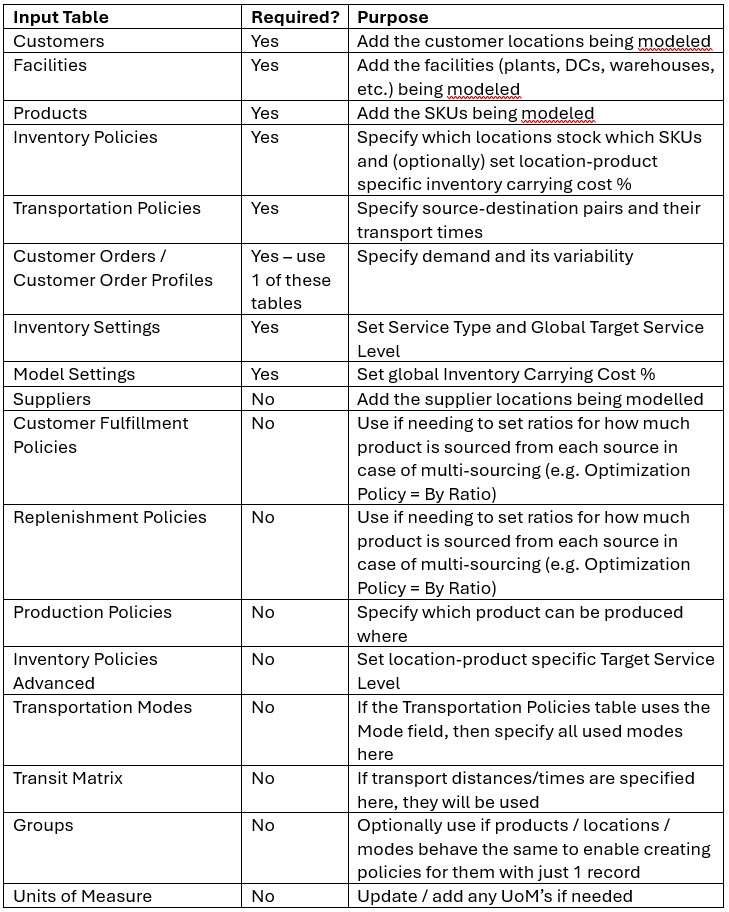
The following table provides an overview of the input tables used by Cyclo, whether they are required, and their purpose. Further below, several screenshots show examples of some of the main inputs in Cosmic Frog.
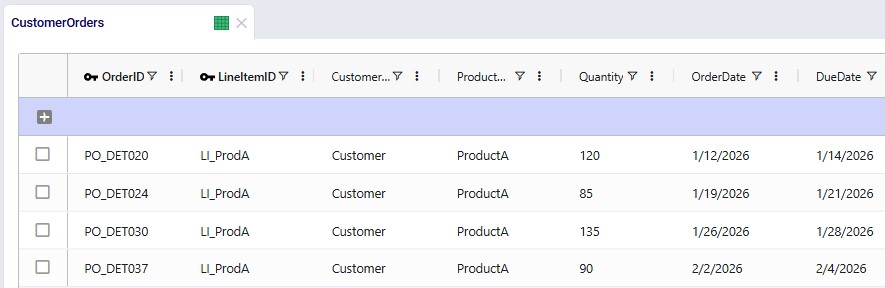
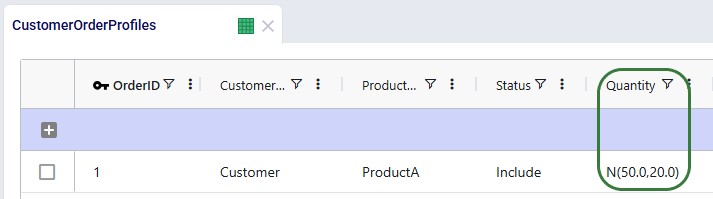
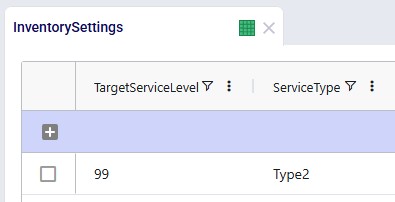
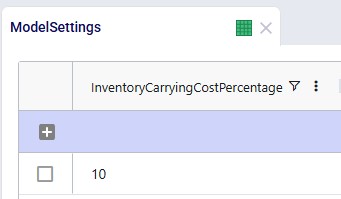
The following screenshots show several input tables with key Cyclo fields.
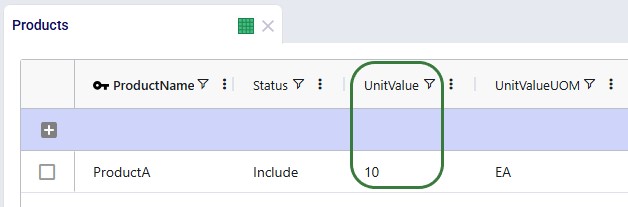
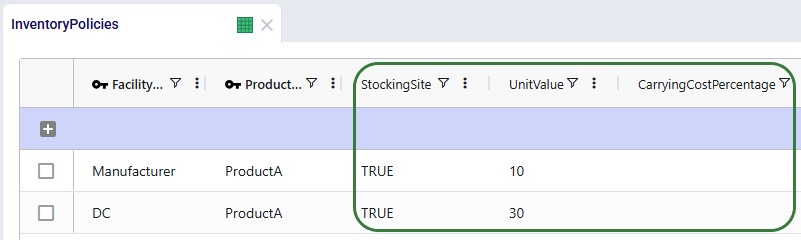
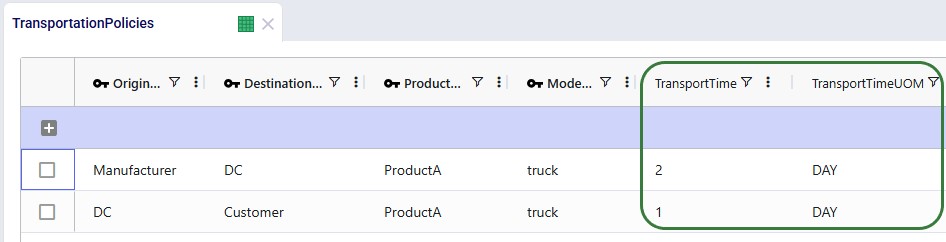
Demand can be specified in either of the Customer Orders and Customer Order Profiles tables. If the Customer Orders table is populated it will be used and the Customer Order Profiles table will be skipped in that case. If the Customer Orders table is blank, the Customer Order Profiles table will be used.
Before running Cyclo, verify that the supply chain network is fully configured. Recommended validation checks:
You can also use Cosmic Frog’s Integrity Checker and filter the results where the Relevant Technology field contains Cyclo.
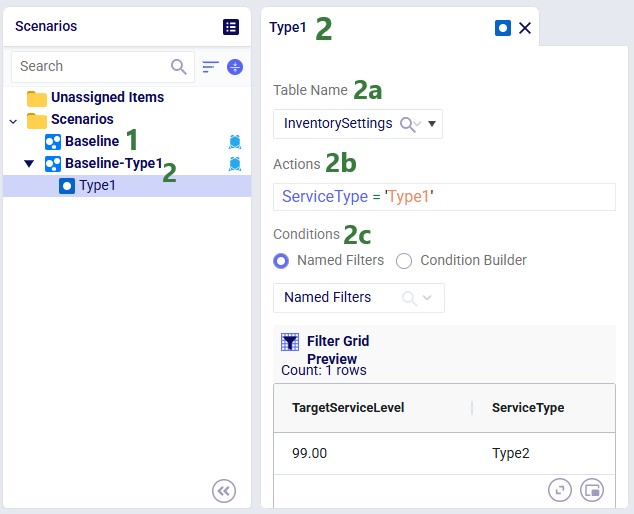
Once the model has been built, you can optionally configure additional scenarios to run. Here 1 additional scenario is added besides the Baseline:
After inputs are validated and scenarios set up, users can kick off their Cyclo optimization run by clicking on the green Run button at the top right in Cosmic Frog, which brings up the Run Settings modal:
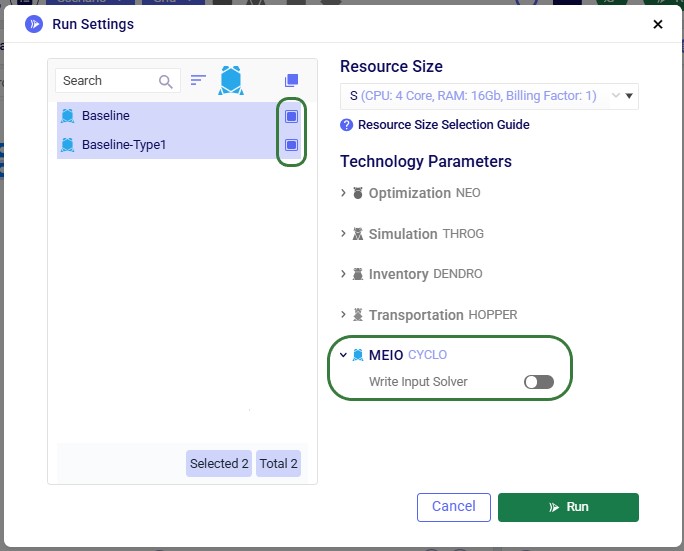
During execution, Cyclo processes:
The optimization engine evaluates inventory decisions holistically across the network rather than independently by node.
After the optimization is completed, review the generated outputs.
The Cyclo outputs are in 2 tables, Inventory Network Summary and Inventory Safety Stock Summary, and include:
Cyclo outputs help users understand recommended inventory placement, service-time commitments, and total network inventory cost tradeoffs.
The Inventory Network Summary summarizes results by scenario:
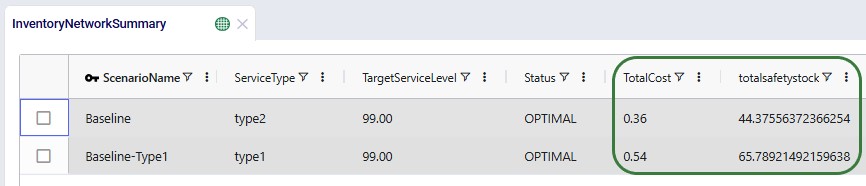
This helps users:
The Inventory Safety Stock Summary shows detailed results at the product x location level, by scenario:
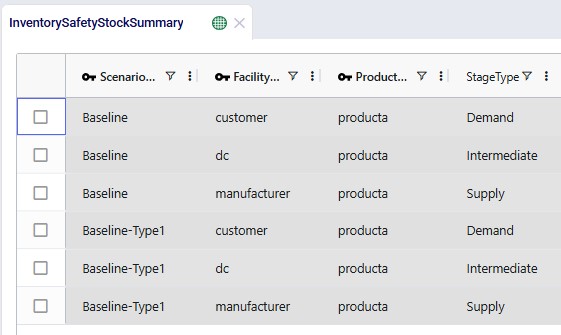
The 4 screenshots in the next sub-sections are of additional fields on the same table and do not always show the fields of the screenshot above again.
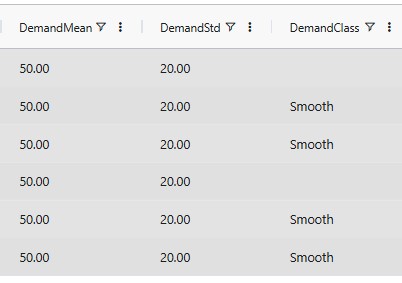
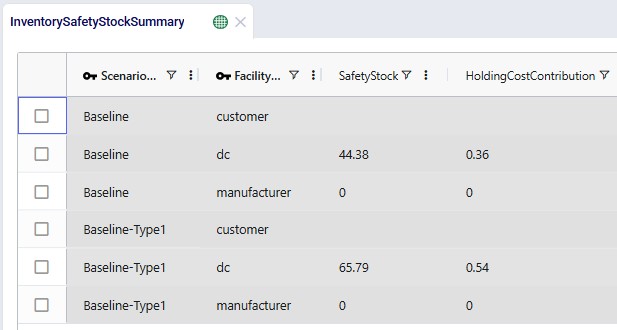
The recommended safety stock reflects:
Note that another field not shown in the screenshot, Holding Cost, is available in this table too. Its value is the holding cost for 1 unit of product at that location for the length of the model run. The Holding Cost Contribution is calculated as this Holding Cost value multiplied with the Safety Stock value.
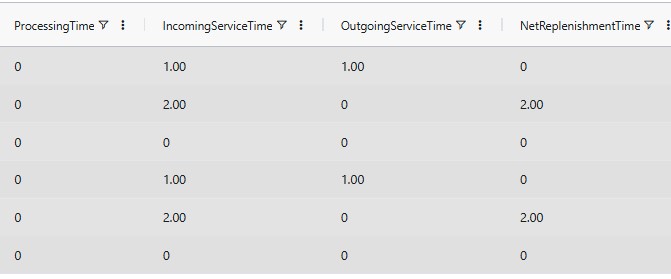
These values represent:
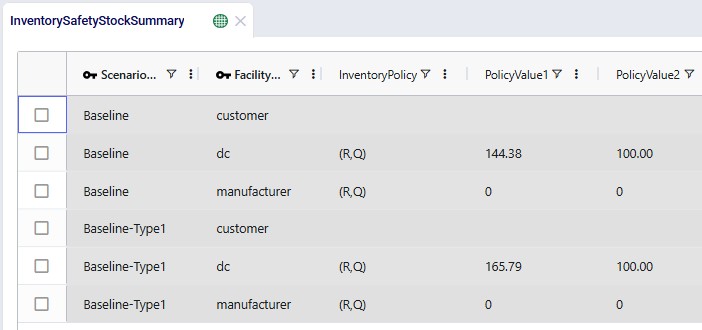
Cyclo can recommend inventory policies and their parameters:
These policies help operationalize inventory decisions.
When reviewing Cyclo outputs, focus on patterns across the network rather than individual locations.
Questions to ask include:
Safety stock optimization quality depends heavily on the quality of the data.
Recommended practices:
Cyclo is especially valuable for scenario analysis.
Examples include:
Scenario comparisons help quantify operational tradeoffs.
MEIO is fundamentally a system-wide optimization problem; avoid evaluating locations independently. The best global solution may intentionally increase inventory at one node in order to reduce much larger inventory requirements elsewhere.
Cyclo outputs are most valuable when reviewed collaboratively by:
Why does Cyclo place more inventory at upstream locations?
In many networks, upstream buffering can reduce downstream safety stock due to variability evening out when aggregating demand from multiple downstream locations (pooling effect). This lowers the total inventory holding cost. Cyclo evaluates these trade-offs automatically.
Does higher service always mean more inventory?
Generally, yes. Higher service-level targets reduce allowable stockout risk, which usually increases safety stock requirements.
Why are service times optimized instead of inventory directly?
The Guaranteed Service Model simplifies the optimization problem and provides a scalable framework for network-wide inventory positioning. Safety stock is derived from optimized service-time relationships.
We will now walk through a Western Europe based life-size template Cyclo model. This model, Cyclo – MEIO, can also be copied to your own account from the Resource Library: Cyclo - MEIO model on the Resource Library.
In this model, we will examine the impact of varying the target service level, reduced demand variability, reduced transport lead-time, and only allowing safety stock to be held at customer facing DCs.
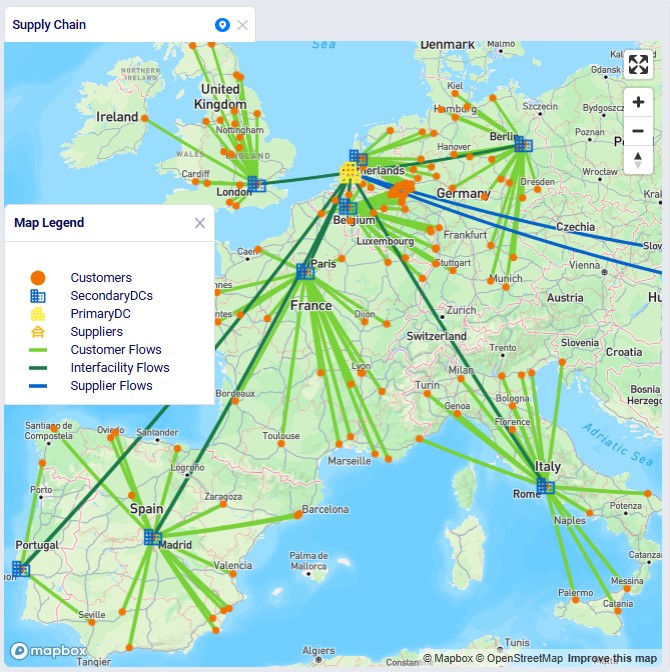
The following map shows most locations and the flow of product in this network:
In this model, the following tables are populated, most of which we will see a screenshot of further below. A reminder that it is helpful to only show Cyclo tables and fields using the Technology Filter at the top.

Facilities
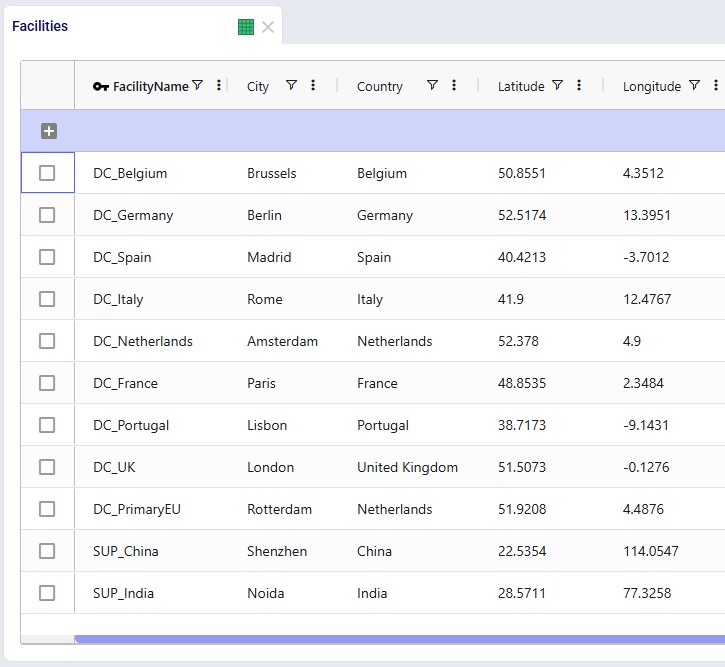
This table contains the 2 suppliers, primary DC in Rotterdam, and 8 country-level secondary DCs. They are geocoded based on city and country data.
Products
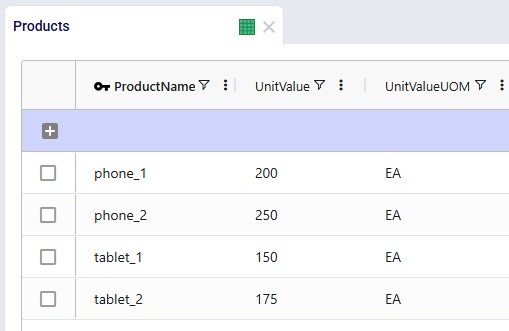
The Products table contains the 4 products which are being modeled. To minimize safety stock, it is important to set a unit value for the products so that safety stock costs can be calculated and minimized.
Production Policies
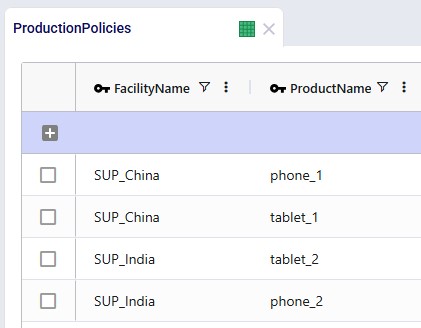
These are not strictly required in this model, as the source of the products can also be deduced from the Transportation Policies table, but the table can be populated if desired. We see that the “_1” products are coming from the supplier in China and the “_2” products are supplied by the India supplier.
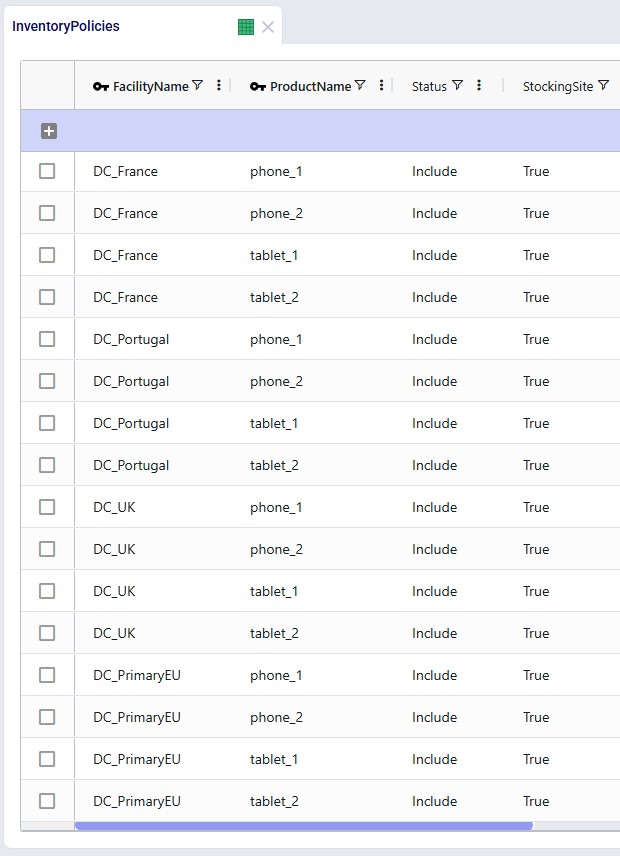
Inventory Policies
For each of the DC-product combinations, a record is specified in this table. Initially, the Stocking Site field is set to True for all, meaning the Primary DC and 8 secondary DCs can all hold safety stock for all 4 products. Note that they are not used in this model, but the Unit Value and Inventory Carrying Cost Percentage fields on this table can be used to override the global values set in the Products and Model Settings tables.
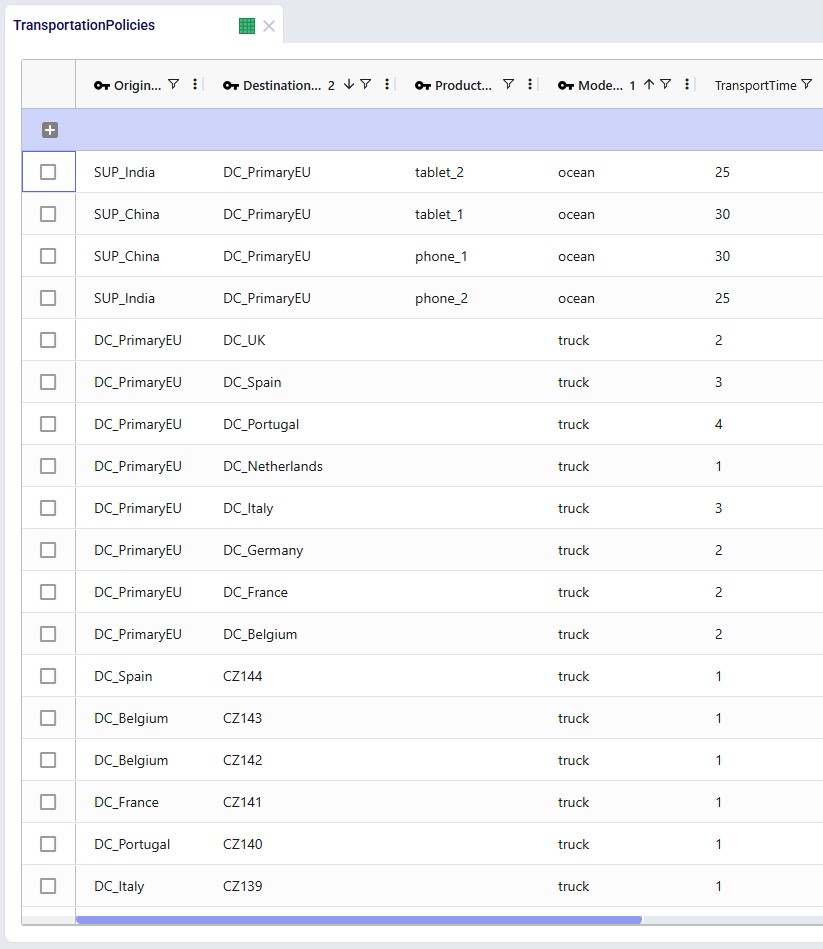
Transportation Policies
The following sets of transportation policies have been added:
Customer Order Profiles
There are 2 sets of demand specified in the Customer Order Profiles table:
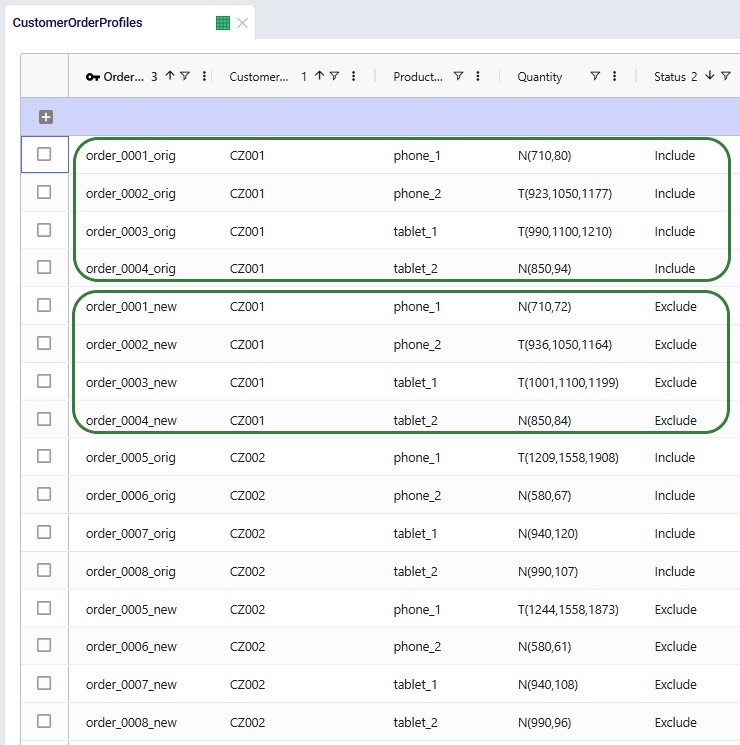
Not shown in the above screenshot: but the Time Between Orders for all these records is set to 7 days, so we are modeling weekly demand.
Inventory Settings
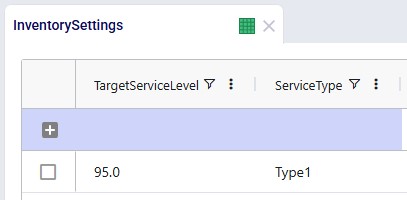
In this model, we have left the target service level and service type at their defaults of 95% and Type 1. The target service level will be varied in several scenarios. Note that it is not used in this model, but you can use the Inventory Policies Advanced table to specify product-location specific target service levels, which will override this global value.
Model Settings
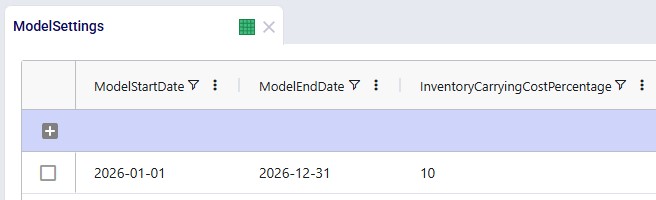
It is important to set an Inventory Carrying Cost Percentage in the Model Settings table to calculate safety stock holding costs. Here it is set to 10%. This global value can be overridden by specifying product-location specific values in the Inventory Policies table.
The following scenarios are included in the template model, from top to bottom:
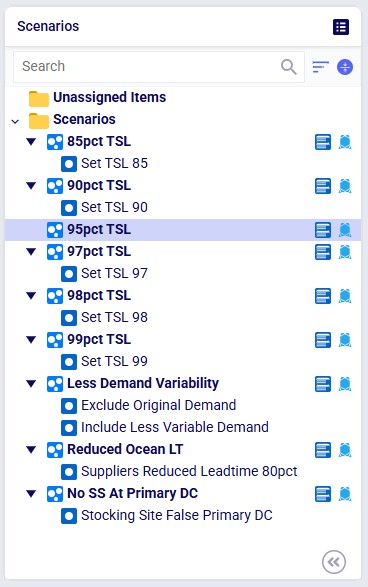
Target Service Level Scenarios
First, we will have a look at the 6 target service level scenarios, for which the outputs in the Inventory Network Summary output table are shown in ascending order of service level:
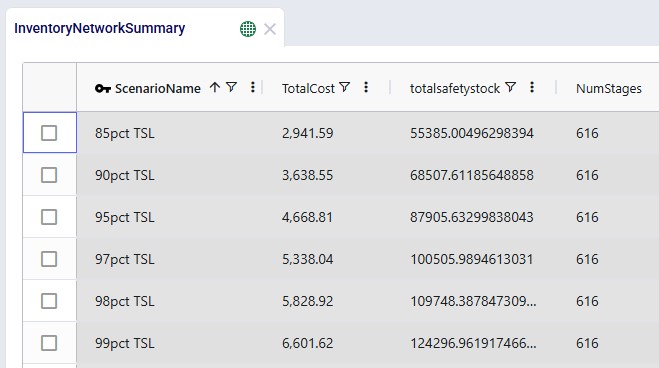
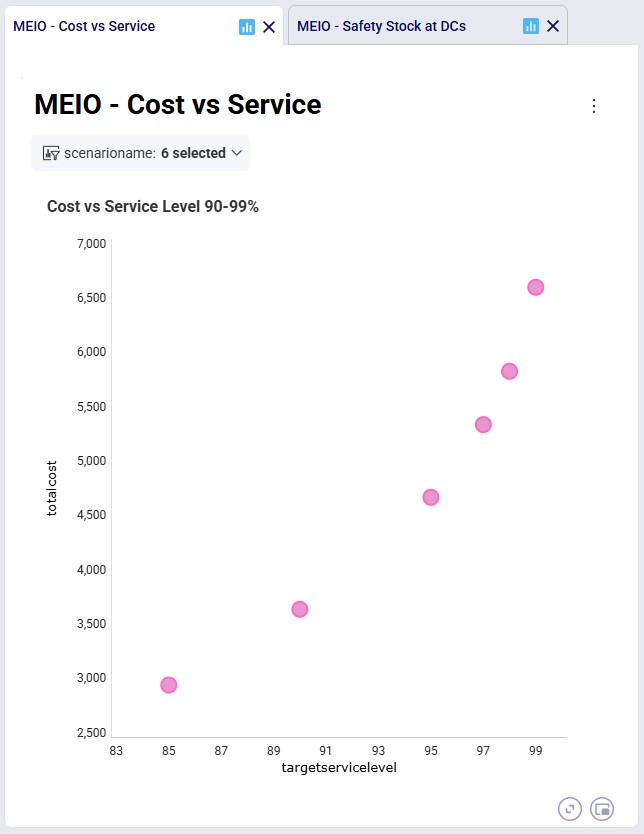
As we expect, the higher the required service level, the more safety stock the network needs to hold, which also leads to increased safety stock holding costs. In the “MEIO – Cost vs Service” dashboard in the Analytics module, we can clearly see that as the service level is being pushed closer to 99%, the cost curve becomes steeper:
Other Scenarios
Now, we will compare the 95% target service level with the other scenarios that were run, which each also require a 95% service level. Starting with the Inventory Network Summary output table again:
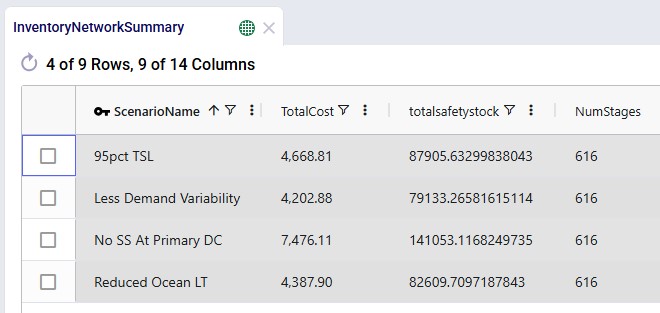
Comparing each scenario with the 95pct TSL baseline scenario, from top to bottom:
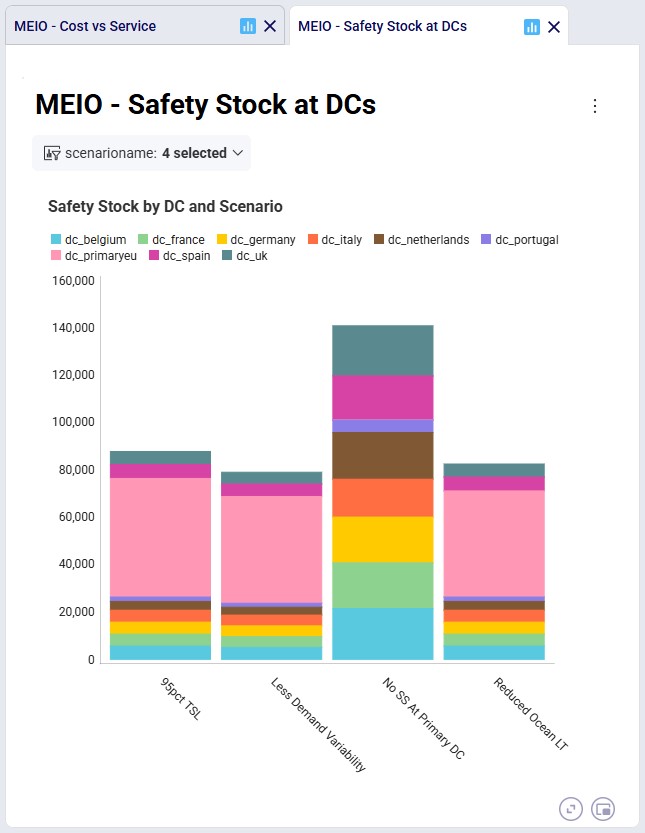
The “MEIO – Safety Stock at DCs” dashboard also shows the safety stock as a stacked column for these 4 scenarios, where the colors indicate the contribution of the total safety stock from each DC. Again, we see that the “Less Demand Variability” and “Reduced Ocean LT” scenarios have overall less safety stock across all DCs as compared to the “95pct TSL” scenario. In the “No SS At Primary DC” scenario, the large pink bucket that represents the safety stock at the primary DC in the other scenarios is not there anymore and instead the other 8 DCs each hold a lot more safety stock than they did in the “95pct TSL” scenario.
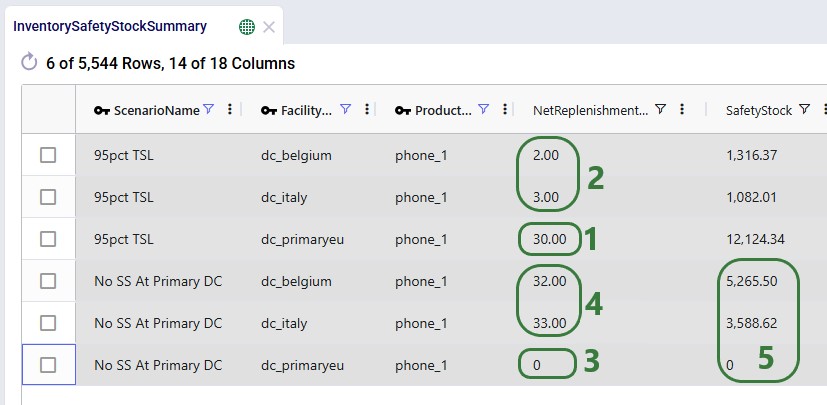
Lastly, we use the Inventory Safety Stock Summary output table to compare the safety stock for 2 secondary DCs and the primary DC for the “95pct TSL” and “No SS At Primary DC” scenarios:
Cyclo brings advanced Multi Echelon Inventory Optimization capabilities into Cosmic Frog.
By optimizing service-time commitments and safety stock placement across the entire supply chain network, Cyclo helps organizations:
Cyclo is especially valuable for organizations operating complex, multi-stage supply chains where local safety stock decisions can create unintended network-wide impacts.
Please do not hesitate to contact our support team on Support@optilogic.com in case of any questions of feedback.

Cyclo is Optilogic’s new Multi Echelon Inventory Optimization (MEIO) engine within Cosmic Frog. It helps supply chain teams determine where safety stock should be held across a network, how much is needed at each stage, and how service levels impact total safety stock cost and responsiveness.
This video gives a quick overview of how to use Cyclo; it uses the Demo Model described further down in this documentation:
If you just want to get going with Cyclo as quick as possible, follow these steps:
Multi Echelon Inventory Optimization (MEIO) is a planning approach used to optimize safety stock across an entire supply chain network.
Cyclo, the MEIO engine, is designed to optimize safety stock placement across multi-stage supply chains that may include suppliers, manufacturing plants, distribution centers, and customer-facing locations. Instead of optimizing each node independently, Cyclo evaluates the entire network simultaneously so organizations can reduce total safety stock while maintaining desired service levels.
Cyclo uses a Guaranteed Service Model (GSM) approach to optimize service-time relationships between facilities and derive recommended safety stock levels.
Cyclo helps organizations answer key supply chain questions such as:
By optimizing safety stock placement across the entire network, Cyclo can help organizations:
Cyclo is especially valuable for:
Both Cyclo and Dendro support inventory optimization workflows in Cosmic Frog, but they are designed for different planning problems.
In practice both can be used together:
Cyclo uses a Guaranteed Service Model (GSM) approach. Rather than directly optimizing safety stock quantities, Cyclo optimizes service-time commitments between facilities. Those service-time decisions are then translated into safety stock requirements.
Represents your risk tolerance – balancing the cost of holding extra buffer inventory against the risk and cost of lost sales. This is a user input. Two risk measures are available:
Service Type 1 is a stricter measure than Type 2 and will in most cases lead to more safety stock.
Time a facility expects upstream suppliers to deliver material. This is a decision variable in the optimization
Time a facility needs to replenish – typically transport time from the upstream location to the facility and/or production/processing time at the facility. These are model inputs.
Time a facility promises to deliver to downstream customers. This is a decision variable in the optimization.
The effective time window over which demand uncertainty accumulates.
In a Guaranteed Service Model (GSM), each facility commits to serving downstream nodes within a defined service time. The effective exposure to uncertainty is the Net Replenishment Time (NRT):
NRT = Incoming Service Time + Fixed Lead Times − Outgoing Service Time
As NRT increases, more uncertainty accumulates and more safety stock is typically required.
Cyclo evaluates many combinations of incoming and outgoing service times across the network to find the lowest total safety stock holding cost, while reaching the target service level. The optimization is not changing any fixed lead times. Instead, it is strategically deciding where responsiveness should exist in the network.
Consider a product with the following flow path:
Manufacturer → Distribution Center → Customer
Assume the following fixed lead times:
The total physical replenishment lead time across the network is therefore 5 days.
These lead times are inputs to the model and are not optimized. What Cyclo optimizes are the service-time commitments between stages. Specifically:
These service times are optimized with the goal to minimize total safety stock holding cost across the network.
In the next example scenarios:
Manufacturer ----> DC (5 days safety stock) ----> Customer
Interpretation:
This approach is common in highly responsive distribution networks.
Manufacturer (2 days safety stock) --> DC (3 days safety stock) --> Customer
Interpretation:
Manufacturer (4 days safety stock) --> DC (1 day safety stock) --> Customer
Interpretation:
The total physical replenishment exposure is driven by the same 5-day total network lead time in all 3 scenarios.
What changes is:
Cyclo evaluates many combinations of:
to determine the optimal inventory strategy across the network.
Without MEIO, organizations often duplicate safety stock across multiple locations and optimize inventory independently at each node. Cyclo instead evaluates the network holistically and strategically concentrates inventory where it is most cost-effective, while achieving the required service level.
The following diagram summarizes the inputs and outputs of the Cyclo engine; they will be covered in more detail in the Cyclo in Cosmic Frog section that follows.
The following workflow provides a step-by-step approach for configuring and running Cyclo.
The following table provides an overview of the input tables used by Cyclo, whether they are required, and their purpose. Further below, several screenshots show examples of some of the main inputs in Cosmic Frog.
The following screenshots show several input tables with key Cyclo fields.
Demand can be specified in either of the Customer Orders and Customer Order Profiles tables. If the Customer Orders table is populated it will be used and the Customer Order Profiles table will be skipped in that case. If the Customer Orders table is blank, the Customer Order Profiles table will be used.
Before running Cyclo, verify that the supply chain network is fully configured. Recommended validation checks:
You can also use Cosmic Frog’s Integrity Checker and filter the results where the Relevant Technology field contains Cyclo.
Once the model has been built, you can optionally configure additional scenarios to run. Here 1 additional scenario is added besides the Baseline:
After inputs are validated and scenarios set up, users can kick off their Cyclo optimization run by clicking on the green Run button at the top right in Cosmic Frog, which brings up the Run Settings modal:
During execution, Cyclo processes:
The optimization engine evaluates inventory decisions holistically across the network rather than independently by node.
After the optimization is completed, review the generated outputs.
The Cyclo outputs are in 2 tables, Inventory Network Summary and Inventory Safety Stock Summary, and include:
Cyclo outputs help users understand recommended inventory placement, service-time commitments, and total network inventory cost tradeoffs.
The Inventory Network Summary summarizes results by scenario:
This helps users:
The Inventory Safety Stock Summary shows detailed results at the product x location level, by scenario:
The 4 screenshots in the next sub-sections are of additional fields on the same table and do not always show the fields of the screenshot above again.
The recommended safety stock reflects:
Note that another field not shown in the screenshot, Holding Cost, is available in this table too. Its value is the holding cost for 1 unit of product at that location for the length of the model run. The Holding Cost Contribution is calculated as this Holding Cost value multiplied with the Safety Stock value.
These values represent:
Cyclo can recommend inventory policies and their parameters:
These policies help operationalize inventory decisions.
When reviewing Cyclo outputs, focus on patterns across the network rather than individual locations.
Questions to ask include:
Safety stock optimization quality depends heavily on the quality of the data.
Recommended practices:
Cyclo is especially valuable for scenario analysis.
Examples include:
Scenario comparisons help quantify operational tradeoffs.
MEIO is fundamentally a system-wide optimization problem; avoid evaluating locations independently. The best global solution may intentionally increase inventory at one node in order to reduce much larger inventory requirements elsewhere.
Cyclo outputs are most valuable when reviewed collaboratively by:
Why does Cyclo place more inventory at upstream locations?
In many networks, upstream buffering can reduce downstream safety stock due to variability evening out when aggregating demand from multiple downstream locations (pooling effect). This lowers the total inventory holding cost. Cyclo evaluates these trade-offs automatically.
Does higher service always mean more inventory?
Generally, yes. Higher service-level targets reduce allowable stockout risk, which usually increases safety stock requirements.
Why are service times optimized instead of inventory directly?
The Guaranteed Service Model simplifies the optimization problem and provides a scalable framework for network-wide inventory positioning. Safety stock is derived from optimized service-time relationships.
We will now walk through a Western Europe based life-size template Cyclo model. This model, Cyclo – MEIO, can also be copied to your own account from the Resource Library: Cyclo - MEIO model on the Resource Library.
In this model, we will examine the impact of varying the target service level, reduced demand variability, reduced transport lead-time, and only allowing safety stock to be held at customer facing DCs.
The following map shows most locations and the flow of product in this network:
In this model, the following tables are populated, most of which we will see a screenshot of further below. A reminder that it is helpful to only show Cyclo tables and fields using the Technology Filter at the top.
Facilities
This table contains the 2 suppliers, primary DC in Rotterdam, and 8 country-level secondary DCs. They are geocoded based on city and country data.
Products
The Products table contains the 4 products which are being modeled. To minimize safety stock, it is important to set a unit value for the products so that safety stock costs can be calculated and minimized.
Production Policies
These are not strictly required in this model, as the source of the products can also be deduced from the Transportation Policies table, but the table can be populated if desired. We see that the “_1” products are coming from the supplier in China and the “_2” products are supplied by the India supplier.
Inventory Policies
For each of the DC-product combinations, a record is specified in this table. Initially, the Stocking Site field is set to True for all, meaning the Primary DC and 8 secondary DCs can all hold safety stock for all 4 products. Note that they are not used in this model, but the Unit Value and Inventory Carrying Cost Percentage fields on this table can be used to override the global values set in the Products and Model Settings tables.
Transportation Policies
The following sets of transportation policies have been added:
Customer Order Profiles
There are 2 sets of demand specified in the Customer Order Profiles table:
Not shown in the above screenshot: but the Time Between Orders for all these records is set to 7 days, so we are modeling weekly demand.
Inventory Settings
In this model, we have left the target service level and service type at their defaults of 95% and Type 1. The target service level will be varied in several scenarios. Note that it is not used in this model, but you can use the Inventory Policies Advanced table to specify product-location specific target service levels, which will override this global value.
Model Settings
It is important to set an Inventory Carrying Cost Percentage in the Model Settings table to calculate safety stock holding costs. Here it is set to 10%. This global value can be overridden by specifying product-location specific values in the Inventory Policies table.
The following scenarios are included in the template model, from top to bottom:
Target Service Level Scenarios
First, we will have a look at the 6 target service level scenarios, for which the outputs in the Inventory Network Summary output table are shown in ascending order of service level:
As we expect, the higher the required service level, the more safety stock the network needs to hold, which also leads to increased safety stock holding costs. In the “MEIO – Cost vs Service” dashboard in the Analytics module, we can clearly see that as the service level is being pushed closer to 99%, the cost curve becomes steeper:
Other Scenarios
Now, we will compare the 95% target service level with the other scenarios that were run, which each also require a 95% service level. Starting with the Inventory Network Summary output table again:
Comparing each scenario with the 95pct TSL baseline scenario, from top to bottom:
The “MEIO – Safety Stock at DCs” dashboard also shows the safety stock as a stacked column for these 4 scenarios, where the colors indicate the contribution of the total safety stock from each DC. Again, we see that the “Less Demand Variability” and “Reduced Ocean LT” scenarios have overall less safety stock across all DCs as compared to the “95pct TSL” scenario. In the “No SS At Primary DC” scenario, the large pink bucket that represents the safety stock at the primary DC in the other scenarios is not there anymore and instead the other 8 DCs each hold a lot more safety stock than they did in the “95pct TSL” scenario.
Lastly, we use the Inventory Safety Stock Summary output table to compare the safety stock for 2 secondary DCs and the primary DC for the “95pct TSL” and “No SS At Primary DC” scenarios:
Cyclo brings advanced Multi Echelon Inventory Optimization capabilities into Cosmic Frog.
By optimizing service-time commitments and safety stock placement across the entire supply chain network, Cyclo helps organizations:
Cyclo is especially valuable for organizations operating complex, multi-stage supply chains where local safety stock decisions can create unintended network-wide impacts.
Please do not hesitate to contact our support team on Support@optilogic.com in case of any questions of feedback.