
Inventory policies describe how inventory is managed across facilities in our supply chain. These policies can include how and when to replenish, how stock is picked out of inventory, and many other important rules.
In general, we add inventory policies using the Inventory Policies table in Cosmic Frog.
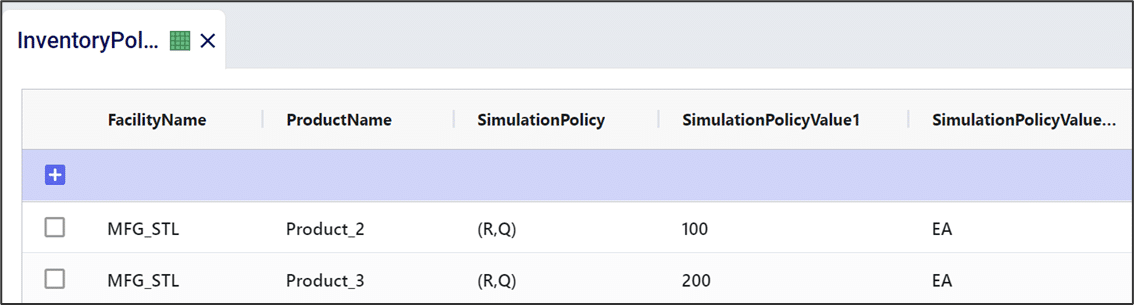
In this documentation we will cover the types of inventory simulation policies available and also other settings contained in the Inventory Policies table.
An (R,Q) policy is a commonly used inventory management approach. Here, when inventory drops below a value of R units, the policy is to order Q units. In Cosmic Frog, when an (R,Q) policy is selected, we can define R and Q in “SimulationPolicyValue1” and “SimulationPolicyValue2”, respectively. We can define the unit of measure (e.g. pallets, volume, individual units, etc.) for both parameters in their corresponding simulation policy value UOM column.
In the following example, MFG_STL has an (R,Q) inventory policy of (100,1900) for Product_2, measured in terms of individual units (i.e. “each”).

(s,S) policies are like (R,Q) policies in that they define a reorder point and how much to reorder. In an(s,S) policy, when inventory is below s units, the policy is to “order up to” S units. In other words, if x is the current inventory level, and x < s, the policy is to order (S-x) units of inventory.
In the example below, DC_VA has an (s,S) inventory policy of (150,750) for Product_1. If inventory dips below 150, the policy is to order so that inventory would replenish to 750 units.

(s,S) policies may also be referred to as (Min,Max) policies; both policy names are accepted in the Anura schema and both behave as described above.
A (T,S) inventory policy is like an (s,S) inventory policy in that whenever inventory is replenished, it is replenished up to level S. Under an (s,S) inventory policy, we check the inventory level in each period when making reorder decisions. In contrast, under a (T,S) inventory policy, the current inventory level is only checked every T periods. During one of these checks, if the inventory level is below S, then inventory is replenished up to level S.
In the example below, DC_VA manages Product_1 using a (T,S) inventory policy. The DC checks the inventory level every 5 days. If inventory is below 750 units during any of these checks, inventory is replenished up to 750 units.

As the name suggests a Do Nothing inventory policy does not trigger any replenishment orders. This policy can for example be used for products that are being phased out or at manufacturing locations where production occurs based on a schedule.
In the example below, MFG_STL uses the Do Nothing inventory policy for the 3 products it manufactures.
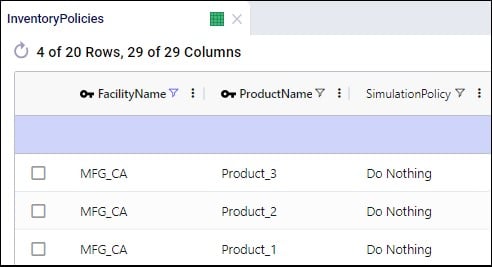
On the inventory policies table, other fields available to the user to model inventory include those to set initial inventory, how often inventory is reviewed, and the inventory carrying cost percentage:

When Only Source From Surplus is set to True on a customer fulfillment or a replenishment policy, the Surplus fields on the Inventory Policies table can be used to specify what is considered surplus inventory for a facility – product combination:

Note that if all inventory needs to be pushed out of a location, Push replenishment policies need to be set up for that location (where the location is the Source), and Surplus Level needs to be set to 0.
Inventory Policy Value fields can also be expressed in terms of the number of days of supply to enable the modelling of inventory where the levels go up or down when (forecasted) demand goes up or down. Please see the help center article “Inventory – Days of Supply (Simulation)” to learn more about how this can be set up and the underlying calculations.
Transportation policies describe how material flows throughout a supply chain. In Cosmic Frog, we can define our transportation policies using the Transportation Policies (required) and Transportation Modes (optional) tables. The Transportation Policies table will be covered in this documentation. In general, we can have a unique transportation policy for each combination of origin, destination, product, and transport mode.

Typically in simulation models, transportation policies are defined over the group of all products (which can be done by leaving Product Name blank as is done in the screenshot above), unless some products need to be prevented from being combined into shipments together on the same mode. If Transportation Policies list products explicitly, these products will not be combined in shipments.
Here, we will first cover the available transportation policies; other transportation characteristics that can be specified in the Transportation Policies table will be discussed in the sections after.
Currently supported transportation simulation policies are:
Selecting “On Volume”, “On Weight”, or “On Quantity” as a simulation policy means that either the volume, weight, or quantity of the shipment will determine which transportation mode is selected. In this case, the “Simulation Policy Value” defines the lowest volume that will go by that mode. We can use multiple lines to define multiple breakpoints for this policy.

Please note that:
If “By Preference” is selected, we can provide a ranking describing which transportation mode we want to use for different origin-destination-product combinations. We can describe our preference using the “Simulation Policy Value” column.

This screenshot shows that all MFG to DC transportation lanes only have 1 Mode of Container and the Simulation Policy is set to By Preference for all of them. If there are multiple Modes available, the By Preference policy will select them pending availability in the order of preference specified by the Simulation Policy Value field, the lowest value being the most preferred mode. If there were 2 modes available and the policy set to By Preference, where 1 mode has a simulation policy value of 1 and the other of 2, the Mode with simulation policy value = 1 will be used if available, if it is not available, the mode with simulation policy value = 2 will be used.
In the following example, the “Container” mode is preferred over the “Truck” mode for the MFG_CA to DC_IL route. Note that since the “Product Name” column is left blank, this policy applies to all products using this route.
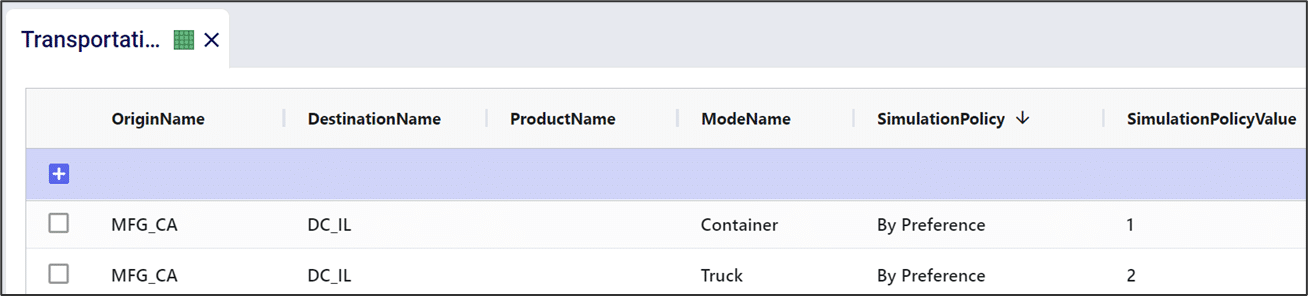
Selecting “By Due Date” is like “By Preference” in that different modes can be ranked via the “Simulation Policy Value”. However, selecting “By Due Date” adds the additional component of demand timing into its selection. This policy selects the highest preference option that can meet the due date of the shipment. The following screenshot shows that the By Due Date simulation policy is used on certain DC to CZ lanes where 2 Modes are used, Truck and Parcel:

Costs associated with transportation can be entered in the Transportation Policies table Fixed Cost and Unit Cost fields. Additionally, the distance and time travelled using a certain Mode can be specified too:

Maximum flow on Lanes (origin-destination-product combinations) and/or Modes (origin-destination-product-mode combinations) can also be specified in the Transportation Policies table:

The Lane Capacity field and its UOM field specify the maximum flow on the Lane, while the Lane Capacity Period and its UOM field are used to indicate over what period of time this capacity applies. In this example, the MFG_CA to DC_AZ lane (first record) has a maximum capacity of 30 shipments every 13 weeks. Once 30 shipments have been shipped on this lane in a 13 week period, this lane cannot be used anymore during those 13 weeks; it is available for shipping again from the first day of the next 13 week period. If a lane’s capacity is reached, it depends on the simulation logic set up what happens. It can for example lead to the simulation making different sourcing decisions: if By Preference sourcing is used and the lane capacity on the lane of the preferred source to the destination has been reached for the period, this source is not considered available anymore and the next preferred source will be checked for availability, etc.
Analogous to the 4 fields to set Lane Capacity shown and discussed above, there are also 4 fields in the Transportation Policies table to set the Lane Mode Capacity where the capacity is specifically applied to a mode and not the whole lane in case multiple Modes exist on the lane: Lane Mode Capacity and its UOM field, and Lane Mode Capacity Period and its UOM field.
There are a few other fields on the Transportation Policies table that the Throg simulation engine will take into account if populated:
In a supply chain model, sourcing policies describe how network components create and order necessary materials. In Cosmic Frog, sourcing policies and rules appear in two different table categories:

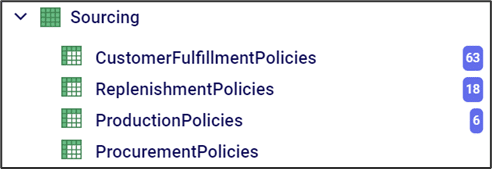
In this section, we describe how to use the model elements tables to define sourcing rules for customers and facilities. Specifically, we can decide if each element is single sourced, allows backorders, and/or allows partial fulfillment.
Single source policies can be defined on either the order level or the line-item level. Setting “Single Source Orders” to “True” for a location means that for each order placed by that location, every item in that order must come from a single source. Setting this value to “False” does not prohibit single sourcing, it just removes the requirement.
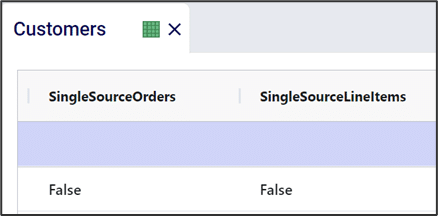
Setting “Single Source Line Items” to “True” only requires each individual line-item come from a single source. In other words, even if this is “True”, an individual order can have multiple sources, as long as each line item is single sourced.
If “Single Source Orders” is set to “True” and “Single Source Line Items” is set to “False”, the “Single Source Orders” value takes precedence.
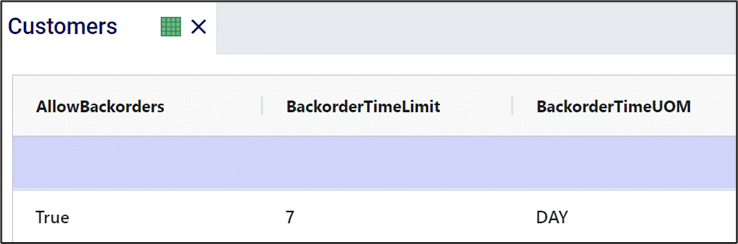
In case an order cannot be fulfilled by the due date (as set on the Customer Orders table in the case of Customers), it is possible to allow backorders where the order will still be filled, but it will be late, by setting the “Allow Backorders” value to “True”. A time limit can be set on this by using the “Backorder Time Limit” field and its UOM field, set to 7 days in the below screenshot. This means that the orders are allowed to be backordered, but if after 7 days the order still is not filled, it is cancelled. Leaving Backorder Time Limit blank means there is no time limit, and the order can be filled late indefinitely.
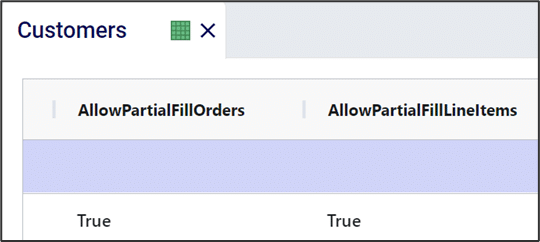
We can also decide to allow partial fulfillment of orders or individual line-items. If “Allow Partial Fill Orders” is set to “False”, orders need to be filled in full. If set to “True”, then only filling part of an order on time (by the due date) is allowed. What happens with the unfulfilled part of the order depends on if backorders are allowed. If so (“Allow Backorders” = “True”), then the remaining quantity of a partially filled order can be satisfied in the future with additional shipments. If a time limit on backorders is set and is reached on a partially filled order, the remaining quantity will be cancelled. “Partial Fill Orders” and “Partial Fill Line Items” behave similarly to the single sourcing policies, where it is possible to for example allow partially filling orders, but not partially filling line items. If “Partial Fill Orders” is set to “True”, then “Partial Fill Line Items” will also be forced to “True”.
The Transportation Modes table is an often used optional input table to run a simulation. Mode attributes like fill levels and capacities are specified in this table to control the size of shipments, which will be explained first in this documentation. Rules of precedence when using multiple fill level / capacity fields and when using On Volume / Weight / Quantity transportation simulation policies will be covered also.
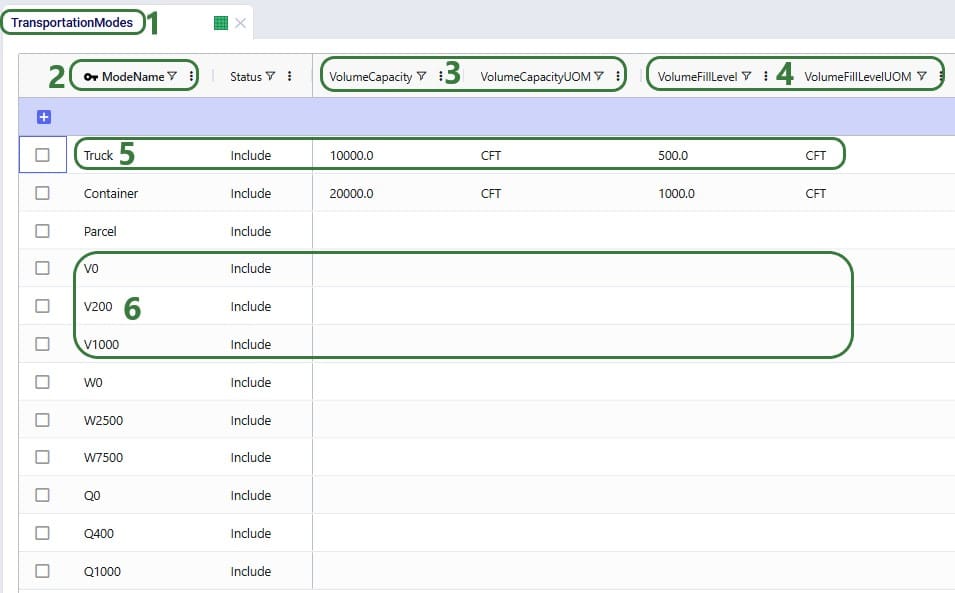
The same capacity and fill level fields as for Volume are also available in this table for Quantity and Weight (not shown in the screenshot above).
When utilizing more than 1 of the Fill Level fields, the one that is reached first is applied. For example, if a shipment’s weight has reached the weight fill level, but its volume has not yet reached the volume fill level, the shipment is allowed to be dispatched.
Similarly, if more than 1 Capacity field has been populated, the one that is reached first is applied. For example, if a shipment’s volume has reached the volume capacity but not yet the weight capacity, it cannot be filled up further and will be dispatched.
As mentioned above, when transportation simulation policies of On Quantity / Weight / Volume are being used, the fill levels and capacities of these Modes are specified in the simulation policy value field on the Transportation Policies table. If also using the Transportation Modes table to set any fill level and/or capacity for these modes, user needs to take note of the effects this may have:
Simulations are generally (mostly) driven by demand specified as customer orders. These orders can be entered in the Customer Orders and/or the Customer Order Profiles input tables. The Customer Orders table typically contains historical transactional demand records to simulate a historical baseline. The Customer Order Profiles table on the other hand contains descriptions of customer order behaviors from which the simulation engine (Throg) generates orders that follow these profiles.
In this documentation we cover both these input table, the Customer Orders table and the Customer Order Profiles table.
To achieve the level of granularity needed and the time-based events to mimic reality as best as possible, every customer order to be simulated is explicitly defined in the customer orders table; this includes line items, order and due dates, and order quantities:
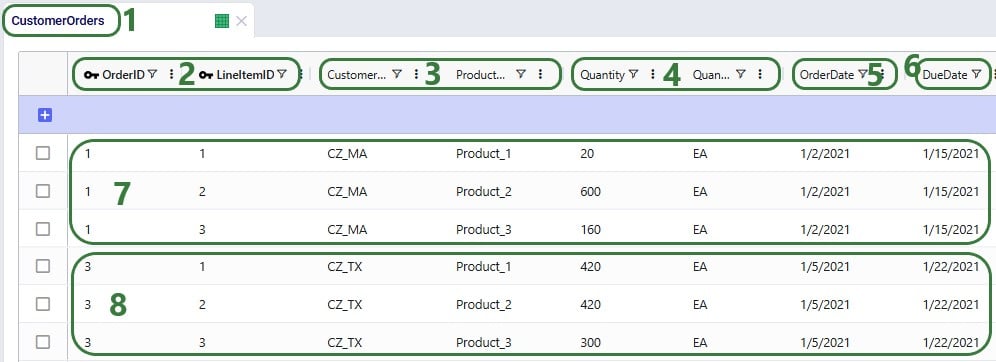
Users can utilize the following additional fields available on the Customer Orders table if required. The single sourcing, allow partial fill, and allow backorder settings behave the same as those that can be set on the Customers table (see this help article), except these here apply to individual orders/individual line items rather than to all orders at the customer over the whole simulation horizon. Note that if these are set here on the Customer Orders table, these values take precedence over any values set for the particular customer in the Customers table:
Rather than specifying individual orders and line items, the Customer Order Profiles table generates these individual orders from profiles which can for example disaggregate monthly demand forecasts into assumed or inferred profiles, using variability to randomize characteristics like quantities and time between orders.
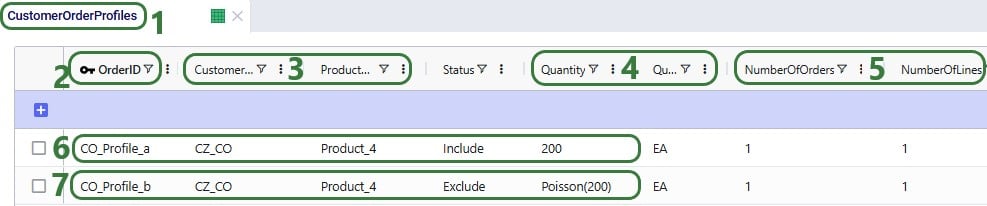

Note that by using start and end dates for profiles, users can control the portion of the simulation horizon in which a profile is used. This enables users to for example capture seasonal demand behaviors by defining a profile for Customer A/Product X in winter, and another profile for the same customer-product combination in summer.
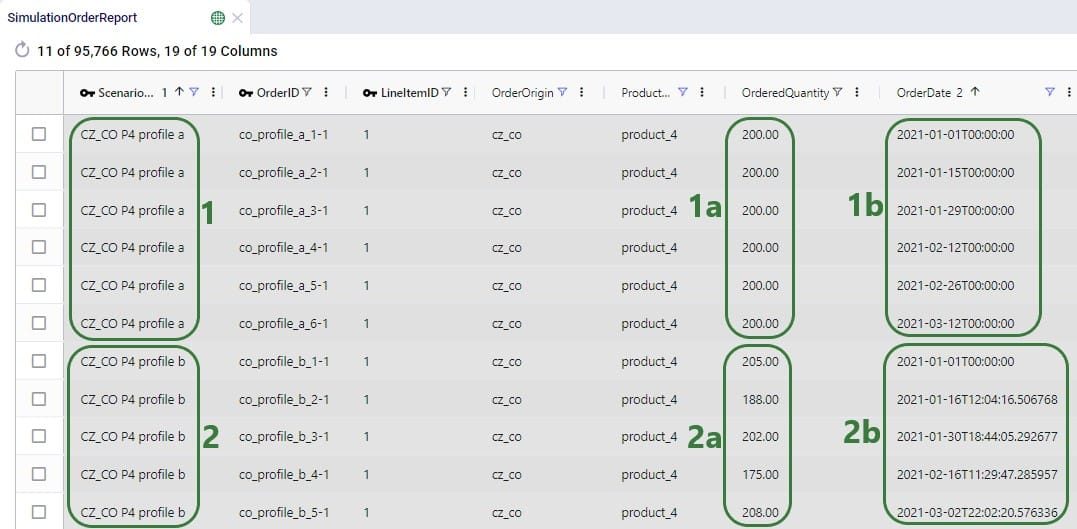
Two scenarios were run, 1 named “CZ_CO P4 profile a” where customer order profile a to generate orders at CZ_CO for Product_4 is included and 1 named “CZ_CO P4 profile b” where customer order profile b to generate orders at CZ_CO for Product_4 is included. These are the profiles shown in the 2 screenshots above. In the Simulation Order Report output table one can see the individual orders generated by these profiles during the simulation runs of these 2 scenarios:
When running models in Cosmic Frog, users can choose the size of the resource the model’s scenario(s) will be run on in terms of available memory (RAM in Gb) and number of CPU cores. Depending on the complexity of the model and the number of elements, policies and constraints in the model, the model will need a certain amount of memory to run to completion successfully. Bigger, more complex models typically need to be run using a resource that has more memory (RAM) available as compared to smaller, less complex models. The bigger the resource that is being used, the higher the billing factor which leads to using more of the available cloud compute hours available to the customer (the total amount of cloud compute time available to the customer is part of customer’s Master License Agreement with Optilogic). Ideally, users choose a resource size that is just big enough to run their scenario(s) without the resource running out of memory, while minimizing the amount of cloud compute time used. This document guides users in choosing an initial resource size and periodically re-evaluating it to ensure optimal usage of the customer’s available cloud compute time.
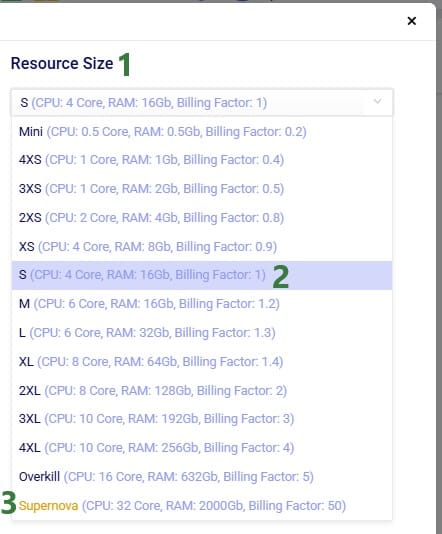
Once a model has been built and the user is ready to run 1 or multiple scenarios, they can click on the green Run button at the right top in Cosmic Frog which opens the Run Settings screen. The Run Settings screen is documented in the Running Models & Scenarios in Cosmic Frog Help Center article. On the right-hand side of the Run Settings screen, user can select the Resource Size that will be used for the scenario(s) that are being kicked off to run:
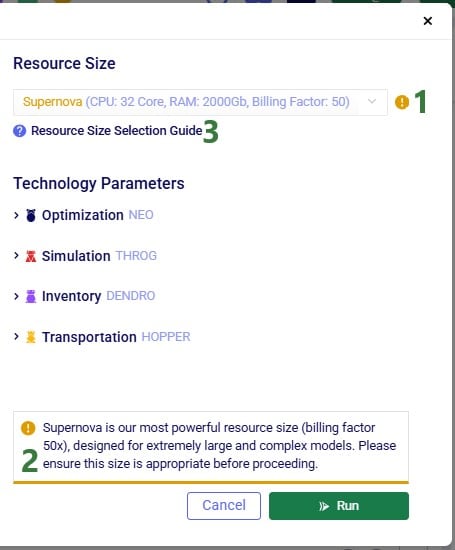
In this section, we will guide users on choosing an initial resource size for the different engines in Cosmic Frog, based on some model properties. Before diving in, please keep following in mind:
There are quite a few model factors that influence how much memory a scenario needs to solve a Neo run. These include the number of model elements, policies, periods, and constraints. The type(s) of constraints used may play a role too. The main factors, in order of impact on memory usage, are:
These numbers are those after expansion of any grouped records and application of scenario items, if any.
The number of lanes can depend on the Lane Creation Rule setting in the Neo (Optimization) Parameters:

Note that for lane creation, expansion of grouped records and application of scenario item(s) need to be taken into account too to get at the number of lanes considered in the scenario run.
Users can use the following list to choose an initial resource size for Neo runs. First, calculate the number of demand records multiplied with the number of lanes in your model (after expansion of grouped records and application of scenario items). Next, find the range in the list, and use the associated recommended initial resource size:
# demand records * # lanes: Recommended Initial Resource Size
A good indicator for Throg and Dendro runs to base the initial resource size selection on is the order of magnitude of the total number of policies in the model. To estimate the total number of policies in the model, add up the number of policies contained in all policies tables. There are 5 policies tables in the Sourcing category (Customer Fulfillment Policies, Replenishment Policies, Production Policies, Procurement Policies, and Return Policies), 4 in the Inventory category (Inventory Policies, Warehousing Policies, Order Fulfillment Policies, and Inventory Policies Advanced), and the Transportation Policies table in the Transportation category. The policy counts of each table should be those after expansion of any grouped records and application of scenario items, if any. The list below shows the minimum recommended initial resource size based on the total number of policies in the model to solve models using the Throg or Dendro engine.
Number of Policies: Minimum Resource
For Hopper runs, memory is the most important factor in choosing the right resource, and the main driver of memory requirements is the number of origin-destination (OD) pairs in the model. OD pairs are determined primarily by all possible facility-to-customer, facility-to-facility, and customer-to-customer lane combinations.
Most Hopper models have many more customers compared to facilities, and so we often can use the number of customers in a model as a guide for resource size. The list below shows the minimum recommended initial resource size to solve models using Hopper.
Customers: Minimum Resource Size
Most Triad models should solve very quickly, typically under 10 minutes. Still, choosing the right resource size will ensure your Triad model solves successfully, without paying for unneeded compute resources.
As with Hopper, memory is the most important factor in resource selection. In Triad, the main driver of memory requirements is the number of customers, with a smaller secondary effect from the number of greenfield facilities.
The list below shows the minimum recommended initial resource size to solve models using Triad where the number of facilities is assumed to be between 1 and 10:
Customers: Minimum Resource Size
Please note:
After running a scenario with the initially selected resource size, users can evaluate if it is the best resource size to use or if a smaller or larger one is more appropriate. The Run Manager application on Optilogic’s platform can be used to assess resource size:
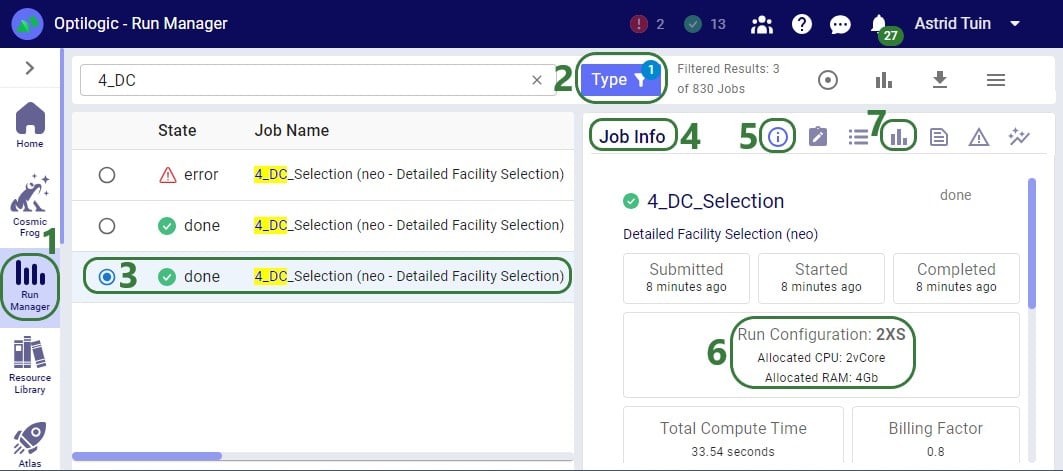
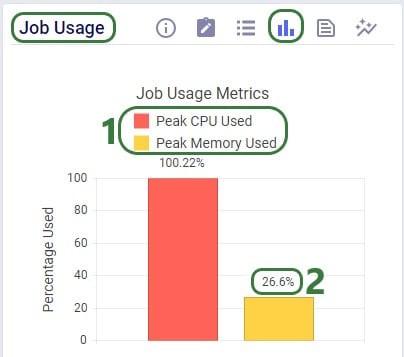
Using this knowledge that the RAM required at peak usage is just over 1 Gb, we can conclude that going down to resource size 3XS, which has 2Gb of RAM available should still work OK for this scenario. The expectation is that going further down to 4XS, which has 1Gb of RAM available, will not work as the scenario will likely run out of memory. We can test this with 2 additional runs. These are the Job Usage Metrics after running with resource size 3XS:
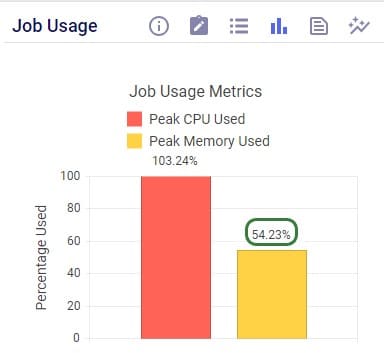
As expected, the scenario runs fine, and the memory usage is now at about 54% (of 2Gb) at peak usage.
Trying with resource size 4XS results in an error:
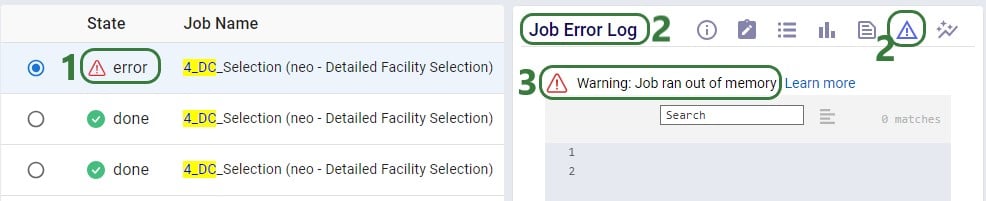
Note that when a scenario runs out of memory like this one here, there are no results for it in the output tables in Cosmic Frog if it is the first time the scenario is run. If the scenario has been run successfully before, then the previous results will still be in the output tables. To ensure that a scenario has run successfully within Cosmic Frog, user can check the timestamp of the outputs in the Optimization Network Summary (Neo), Transportation Summary (Hopper), or Optimization Greenfield Output Summary (Triad) output tables, or review the number of error jobs versus done jobs at the top of Cosmic Frog (see next screenshot). If either of these 2 indicate that the scenario may not have run, then double-check in the Run Manager and review the logs there to find the cause.

In the status bar at the top of Cosmic Frog, user can see that there were 2 error jobs and 13 done jobs within the last 24 hours.
In conclusion, for this scenario we started with a 2XS resource size. Using the Run Manager, we reviewed the percentage of memory used at peak usage in the Job Usage Metrics and concluded that a smaller 3XS resource size with 2Gb of RAM should still work fine for this scenario, but an even smaller 4XS resource size with 1Gb of RAM would be too small. Test runs using the 3XS and 4XS resource sizes confirmed this.
Transportation lanes are a necessary part of any supply chain. These lanes represent how product flows throughout our supply chain. In network optimization, transportation lanes are often referred to as arcs or edges.
In general, lanes in our supply chain are generated from the transportation policies and sourcing policies provided in our data tables.
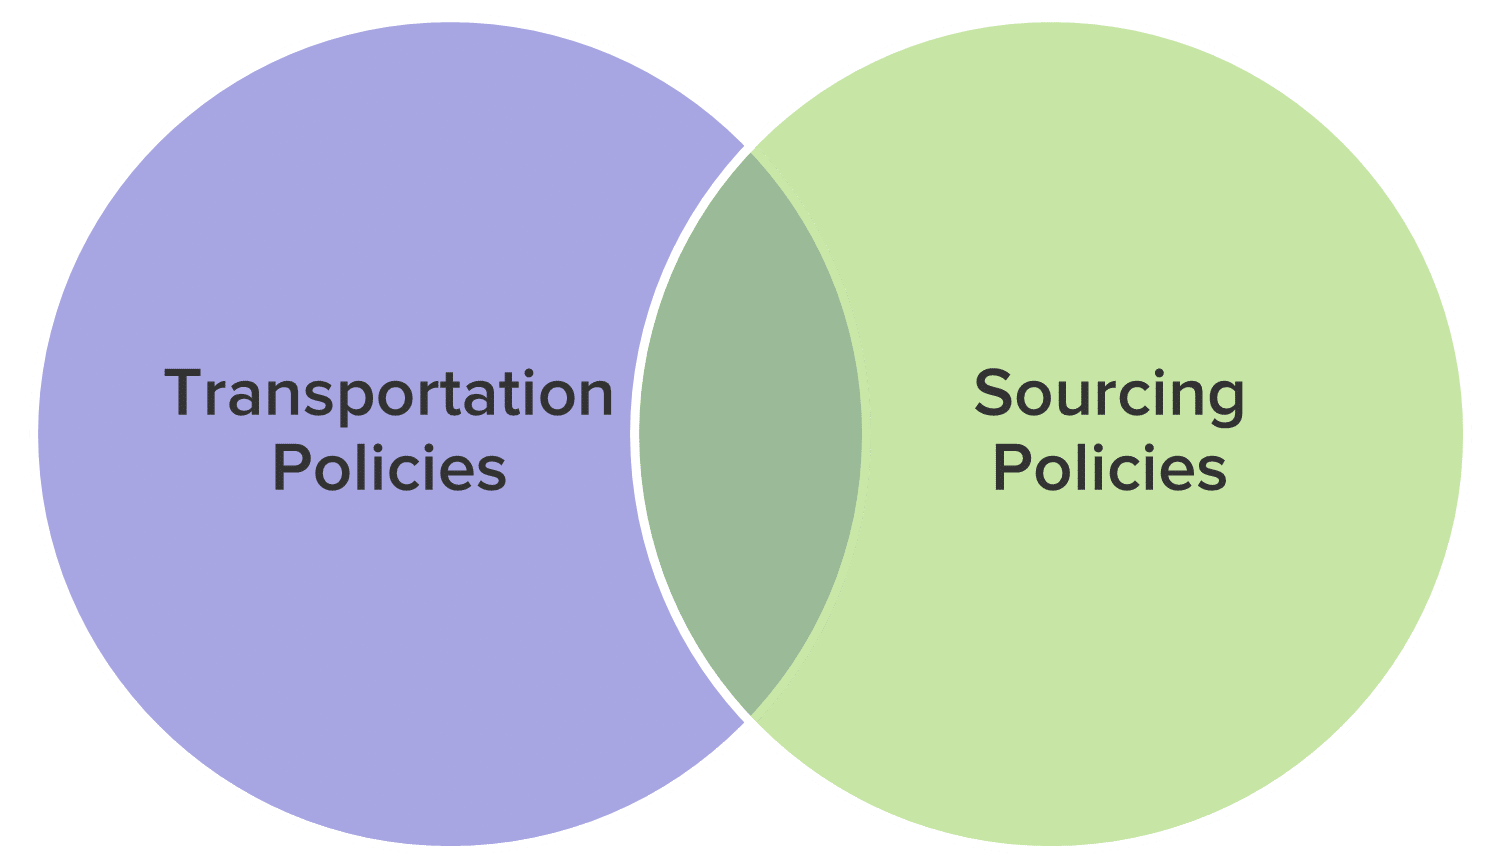
Transportation policies are stored in the TransportationPolicies table. Sourcing policies are stored in the following tables:
From the data in these tables, the software automatically generates the lanes (i.e. arcs or edges) in our network before sending it to the optimization solver. We can control how these lanes are generated as a parameter of our Neo model.
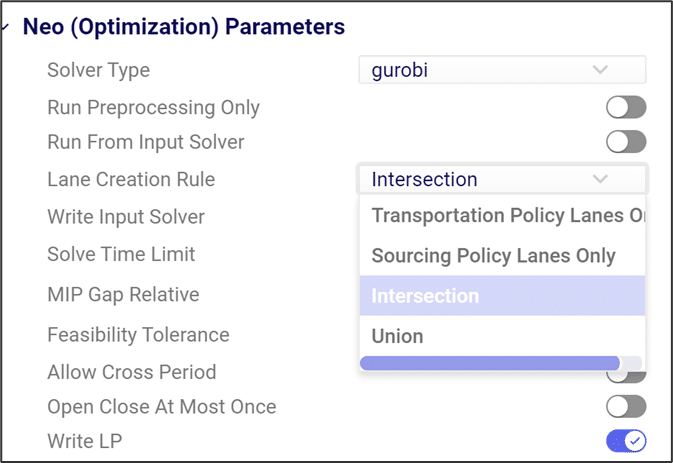
Neo models can follow 4 different lane creation policies:
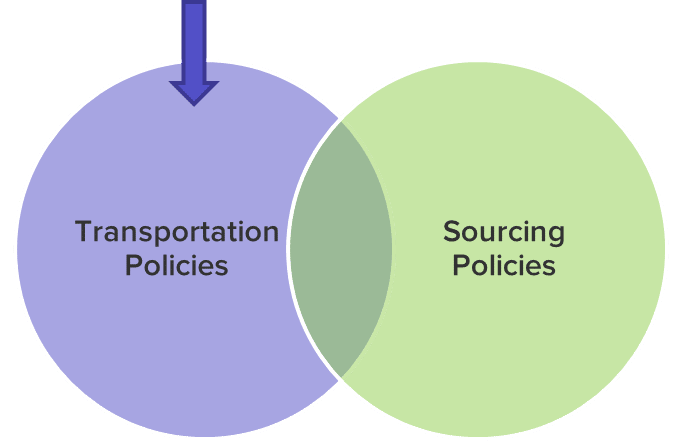
If the “Transportation Policy Lanes Only” rule is selected, Cosmic Frog will only generate transportation lanes based on data in the TransportationPolicies table. If a lane between two sites is not explicitly defined here, product will not be able to directly flow between those sites. Note that any additional information specified in a Sourcing Policy table (unit cost, policy rule etc.) will still be respected for the lane so long as it exists in the Transportation Policies table.
If the “Sourcing Policy Lanes Only” rule is selected, Cosmic Frog will only generate transportation lanes based on data in the Sourcing tables. Even if an origin-destination path is defined in the TransportationPolicies table, product will not be able to flow via this lane unless there is a specific sourcing policy defining how the destination site gets product from the origin site. Note that any additional information specified in a Transportation Policies table (cost, policy rule, multiple modes etc.) will still be respected for the lane so long as it exists in a Sourcing Policy table.

If the “Intersection” rule is selected, Cosmic Frog will only generate transportation lanes if they are defined in both the transportation policy table and one of the sourcing policy tables.
For users converting models from Supply Chain Guru©, the default SCG© lane creation rule is “Intersection”.
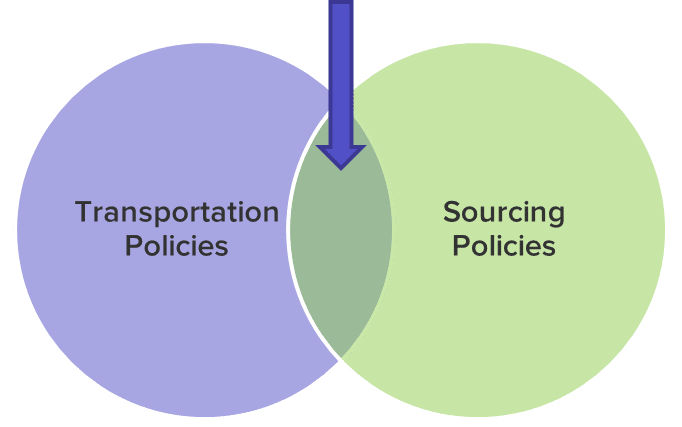
If the “Union” rule is selected, Cosmic Frog will generate transportation lanes if they are defined in either the transportation policy table or one of the sourcing policy tables.
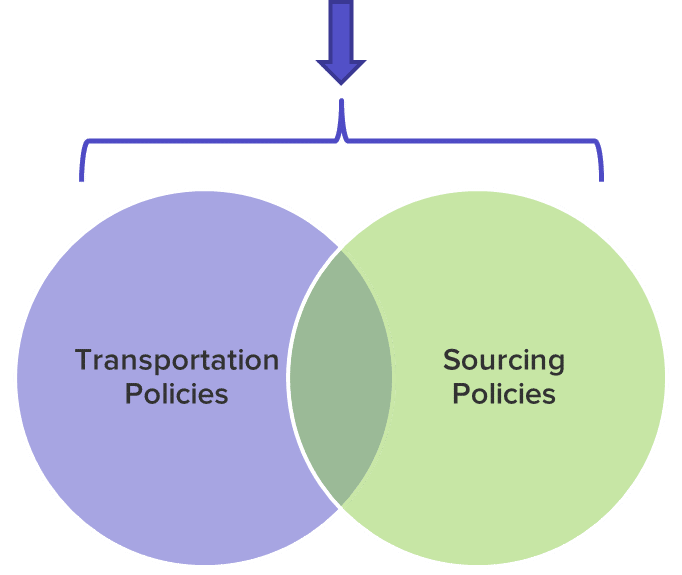
Here we will cover the options a Cosmic Frog user has for modeling transportation costs when using the Neo Optimization engine. The different fields that can be populated and how the calculations under the hood work will be explained in detail.
There are many ways in which transportation can be costed in real life supply chains. The Transportation Policies table contains 4 cost fields to help users model costs as close as possible to reality. These fields are: Unit Cost, Fixed Cost, Duty Rate and Inventory Carrying Cost Percentage. Not all these costs need to be used: the one(s) that are applicable should be populated and the others can be left blank. The way some of these costs work depends on additional information specified in other fields, which will be explained as well.
Note that in the screenshots throughout this documentation some fields in the Cosmic Frog tables have been moved so they could be shown together in a screenshot. You may need to scroll right to see the same fields in your Cosmic Frog model tables and they may be in a different order.
We will first discuss the input fields with the calculations and some examples; at the end of the document an overview is given of how the cost inputs translate to outputs in the optimization output tables.
This field is used for transportation costs that increase when the amount of product being transported increases and/or the transportation distance or time increases. As there are quite a few different measures based on which costs can depend on the amount of product that is transported (e.g. $2 per each, or $0.01 per each per mile, or $10 per mile for a whole shipment of 1000 units, etc.) there is a Unit Cost UOM field that specifies how the cost specified in the Unit Cost field should be applied. In a couple of cases, the Average Shipment Size and Average Shipment Size UOM fields must be specified too as we need to know the total number of shipments for the total Unit Cost calculation. The following table provides an overview of the Unit Cost UOM options and explains how the total Unit Costs are calculated for each UOM:


With the settings as in the screenshot above, total Unit Costs will be calculated as follows for beds, pillows, and alarm clocks going from DC_Reno to CUST_Phoenix:
The Unit Cost field can contain a single numeric value (as in the examples above), a step cost specified in the Step Costs table, a rate specified in the Transportation Rates table, or a custom cost function.
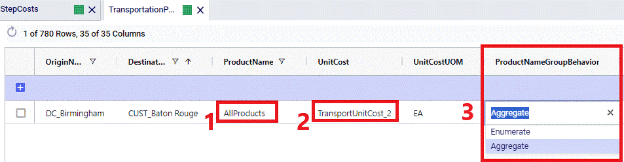
If stepped costs are used as the Unit Cost for Transportation Policies that use Groups in the Product Name field, then the Product Name Group Behavior field determines how these stepped costs are applied:
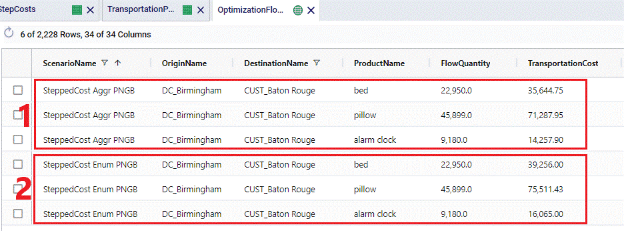
See following screenshots for an example of using stepped costs in the Unit Cost field and the difference in cost calculations for when Product Name Group Behavior is set to Enumerate vs Aggregate:
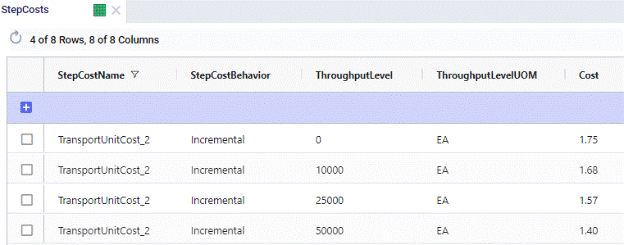
On the Step Costs table (screenshot above), the stepped costs we will be using in the Unit Cost field on the Transportation policies table are specified. All records with the same Step Cost Name (TransportUnitCost_2 here) make up 1 set of stepped costs. The Step Cost Behavior is set to Incremental here, meaning that discounted costs apply from the specified throughput level only, not to all items once we go over a certain throughput. So, in this example, the per unit cost for units 0 through 10,000 is $1.75, $1.68 for units 10,001 through 25,000, $1.57 for units 25,001 through 50,000, and $1.40 for all units over 50,000.
The configuration in the Transportation Policies table looks as follows:
The following screenshot shows the outputs on the Optimization Flow Summary table of 2 scenarios that were run with these stepped costs, 1 scenario used the Enumerate option for the Product Name Group Behavior and the other 1 used the Aggregate option. The cost calculations are explained below the screenshot.
The Fixed Cost field can be used to apply a fixed cost to each shipment for the specified origin-destination-product-mode combination. An average shipment size needs to be specified to be able to calculate the number of shipments from the amount of product that is being transported. When calculating the number of shipments, the result can contain fractions of shipments, e.g. 2.8 or 5.2. If desirable, these can be rounded up to the next integer (e.g. 3 and 6 respectively) by setting the Fixed Cost Rule field to Treat As Full. Note however that using this setting can increase model runtimes, and using the default Prorate setting is recommended in most cases.
In summary, The Fixed Cost field therefore works together with the Fixed Cost Rule, Average Shipment Size, and Average Shipment Size UOM fields. The following table shows how the calculations work:

The Fixed Cost field can contain a single numeric value, or a step cost specified in the Step Costs table.
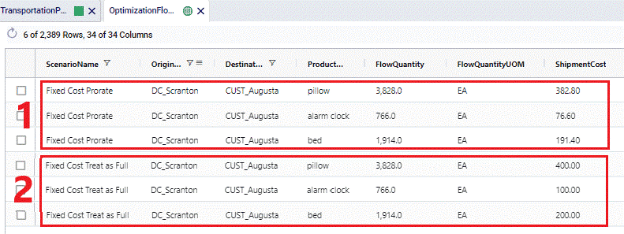
Following example shows how Fixed Costs are calculated on the DC_Scranton – CUST_Augusta lane and illustrates the difference between setting the Fixed Cost Rule to Prorate vs Treat As Full

This setup in the Transportation Policies table means that the cost for 1 shipment with on average 1,000 units on it is $100. 2 scenarios were run with this cost setup, 1 where Fixed Cost Rule was set to Prorate and 1 where it was set to Treat As Full. Following screenshot shows the outputs of these 2 scenarios:
For Fixed Costs on Transportation Policies that use Groups in the Product Name field, the Product Name Group Behavior field determines how these fixed costs are applied:
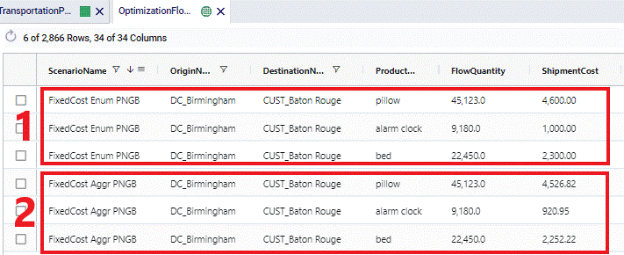
See following screenshots for an example of using Fixed Costs where the Fixed Cost Rule is set to Treat As Full and the difference in cost calculations for when Product Name Group Behavior is set to Enumerate vs Aggregate:

The transportation policy from DC_Birmingham to CUST_Baton Rouge uses the AllProducts group as the ProductName. This Group contains all 3 products being modelled: beds, pillows, and alarm clocks. The costs on this policy are a fixed cost of $100 per shipment, where an average shipment contains 1,000 units. The Fixed Cost Rule is set to Treat As Full meaning that the number of shipments will be rounded up to the next integer. Depending on the Product Name Group Behavior field this is done for the flow of each product individually (when set to Enumerate) or done for the flow of all 3 products together (when set to Aggregate):
When products are imported or exported from/to different countries, there may be cases where duties need to be paid. Cosmic Frog enables you to capture these costs by using the Duty Rate field on the Transportation Policies table. In this field you can specify the percentage of the Product Value (as specified on the Products table) that will be incurred as duty. If this percentage is for example 9%, you need to enter a value of 9 into the Duty Rate field. The calculation of total duties on a lane is as follows: Flow Quantity * Product Value * Duty Rate.
The following screenshots show the Product Value of beds, pillows and alarm clocks in the Products table, the Duty Rate set to 10% on the DC_Birmingham to CUST_Nashville lane in the Transportation Policies table, and the resulting Duty Costs in the Optimization Flow Summary table, respectively.
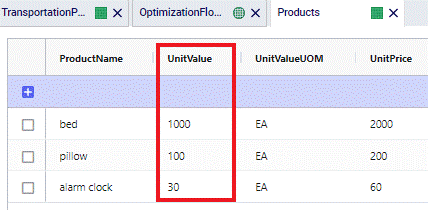
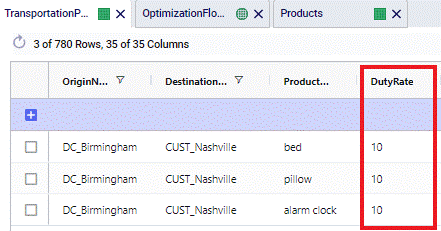
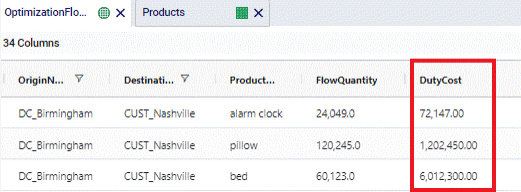
Alarm clocks have a Product Value of $30. With a Duty Rate of 10% and moving 24,049 from DC_Birmingham to CUST_Nashville, the resulting Duty Cost = 24,049 * $30 * 0.1 = $72,147.
If in transit inventory holding costs need to be calculated, the Inventory Carrying Cost Percentage field on the Transportation Policies table can be used. The value entered here will be used as the percentage of product value (specified on the Products table) to incur the in transit holding costs. If the Inventory Carrying Cost Percentage is 13%, then enter a value of 13 into this field. This percentage is interpreted as an annual percentage, so the in transit holding cost is then prorated based on transit time. The calculation of the in transit holding costs becomes: Flow Quantity * Product Value * Inventory Carrying Cost Percentage * Transit Time (in days) / 365.
Note that there is also an Inventory Carrying Cost Percentage field in the Model Settings table. If this is set to a value greater than 0 and there is no value specified in the Transportation Policies table, the value from the Model Settings table is automatically used for inventory carrying cost calculations, including in transit holding costs. If there are values specified in both tables, the one(s) in the Transportation Policies table take precedence for In Transit Holding Cost calculations.
The following screenshots show the Inventory Carrying Cost Percentage set to 20% on the DC_Birmingham to CUST_Nashville lane in the Transportation Policies table, and the resulting In Transit Holding Costs in the Optimization Flow Summary table, respectively. The Product Values are as shown in the screenshot of the Products table in the previous section on Duty Rates.
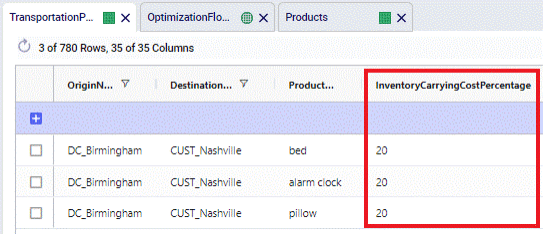
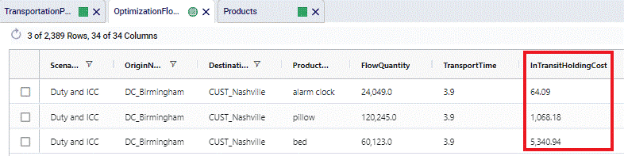
For Pillows, the Product Value set on the Products Table is $100. When 120,245 units are moved from DC_Birmingham to CUST_Nashville, which takes 3.8909 hours (214 MI / 55 MPH), the In Transit Holding Costs are calculated as follows: 120,245 (units) * $100 (product value) * 0.2 (Carrying Cost Percentage) * (3.8909 HR (transport time) / 24 (HRs in a day)) / 365 (days in a year) = $1,068.18.
The following table gives an overview of how the inputs into the 4 cost fields on the Transportation Policies table translate to outputs in multiple optimization output tables. The table contains the field names in the output tables and shows from which input field they result.
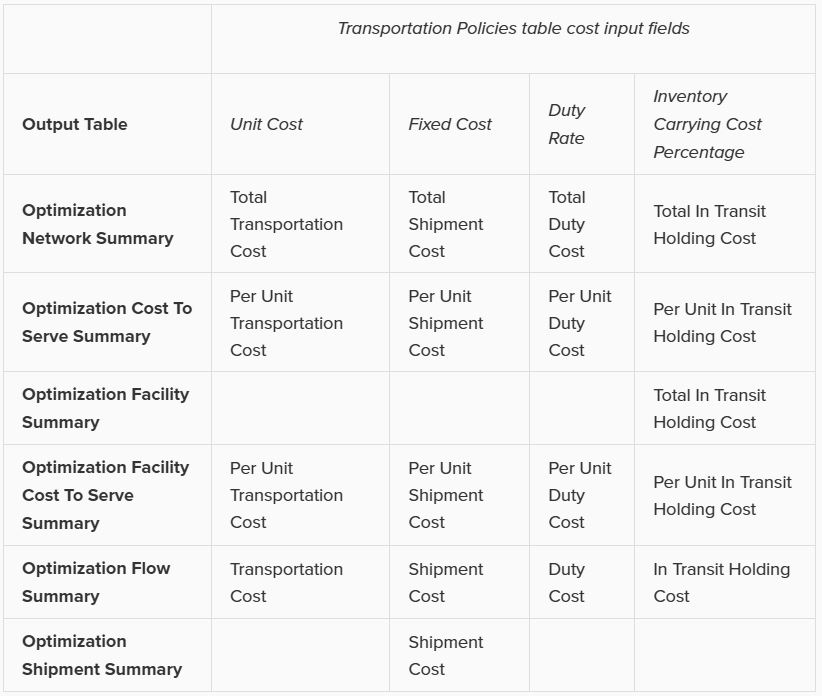
Note that the 4 different types of transportation costs are also included in the Landed Cost (Optimization Demand Summary table) and Parent Node Cost (Optimization Cost To Serve Parent Information Report table) calculations.
The SQL Editor helps users write, edit, and execute SQL (Structured Query Language) queries within Optilogic’s platform. It provides direct access to database objects such as tables and views stored within the platform. In this documentation, the Anura Supply Chain Model Database (Cosmic Frog’s database) will be used as the database example.
Anura model exploration and editing are enabled through the three windows of the SQL Editor:
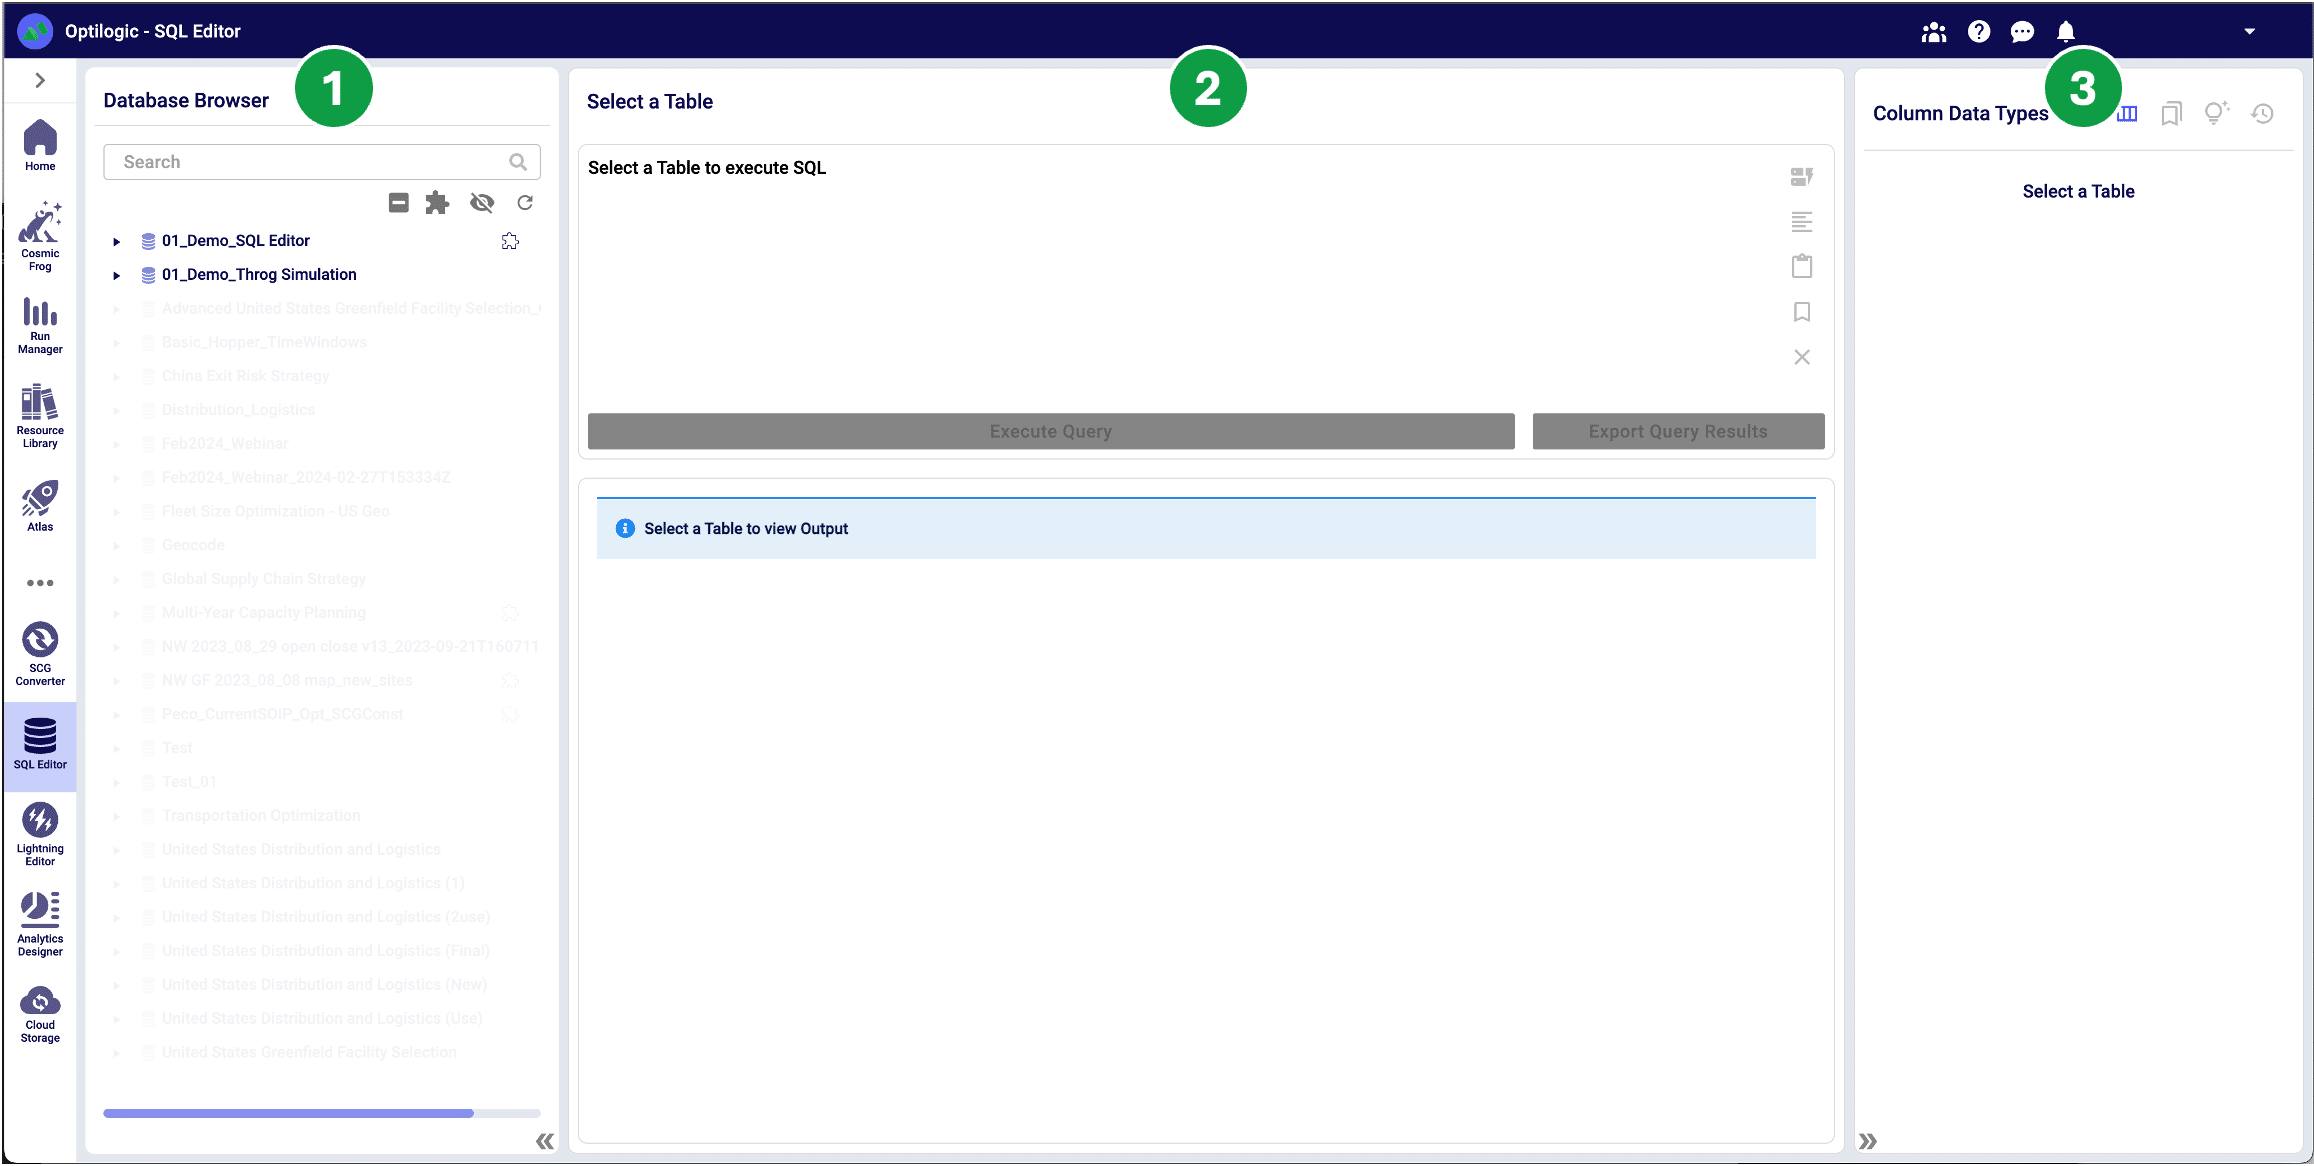
The Anura database is stored in PostgreSQL and exclusively supports PostgreSQL query statements to ensure optimized performance. Visit https://www.postgresql.org/ for more detailed information.
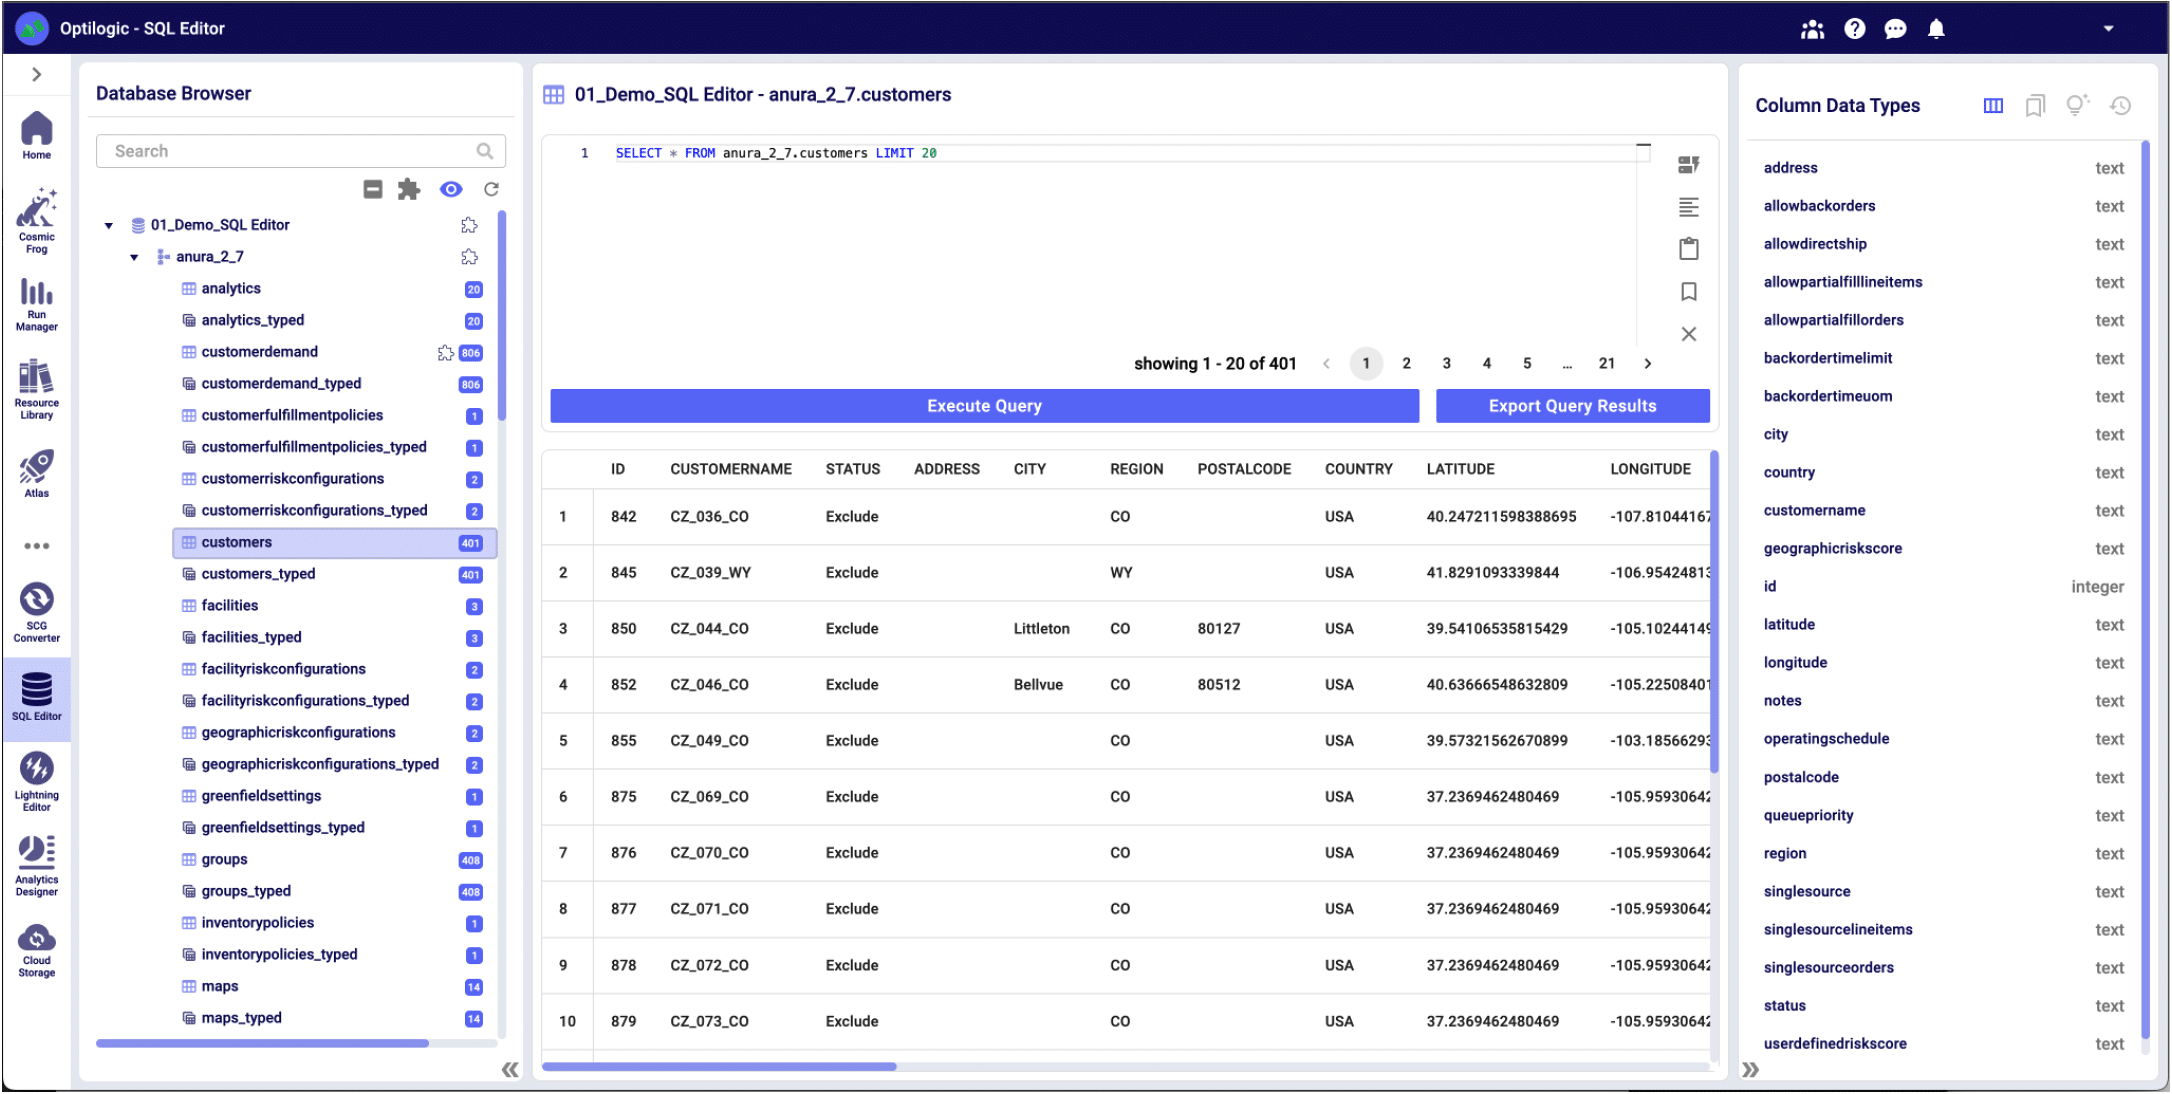
To enable the SQL editor, select a table or view from a database. Once selected, the SQL Editor will prepopulate a Select query, and the Metadata Explorer displays the table schema to enable initial data exploration.
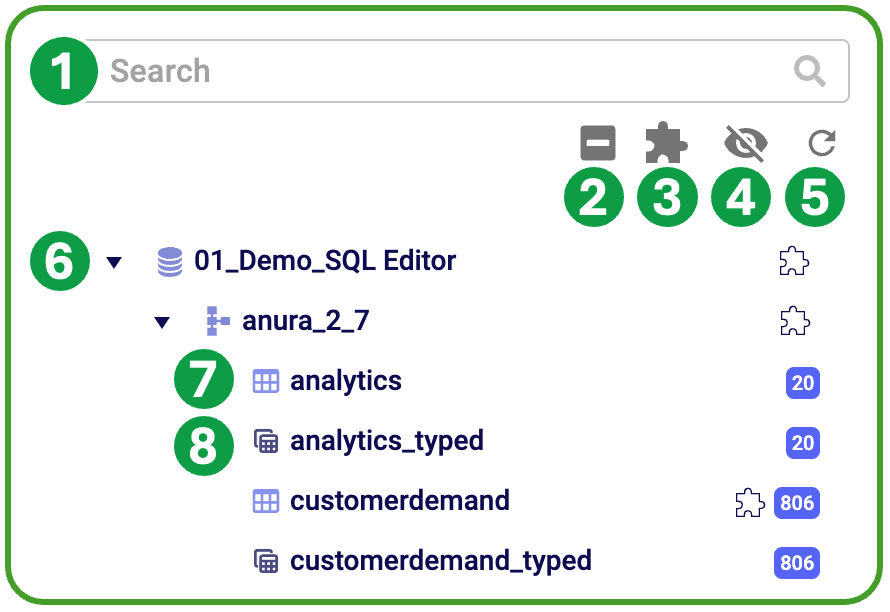
The Database Browser offers several tools to explore your databases and display key information.
The Query Editor enables users to create and execute custom SQL queries and view the results. Reserved words are highlighted in blue to assist in SQL editing. This window is not enabled until a model table or view has been selected from the database browser; once selected, the user is able to customize this query to run in the context of the selected database.

The Metadata Explorer provides a set of tools to efficiently create and store SQL queries.

SQL is a powerful language that allows you to manipulate and transform tabular data. The query basics overview will help guide you through creating basic SQL queries.
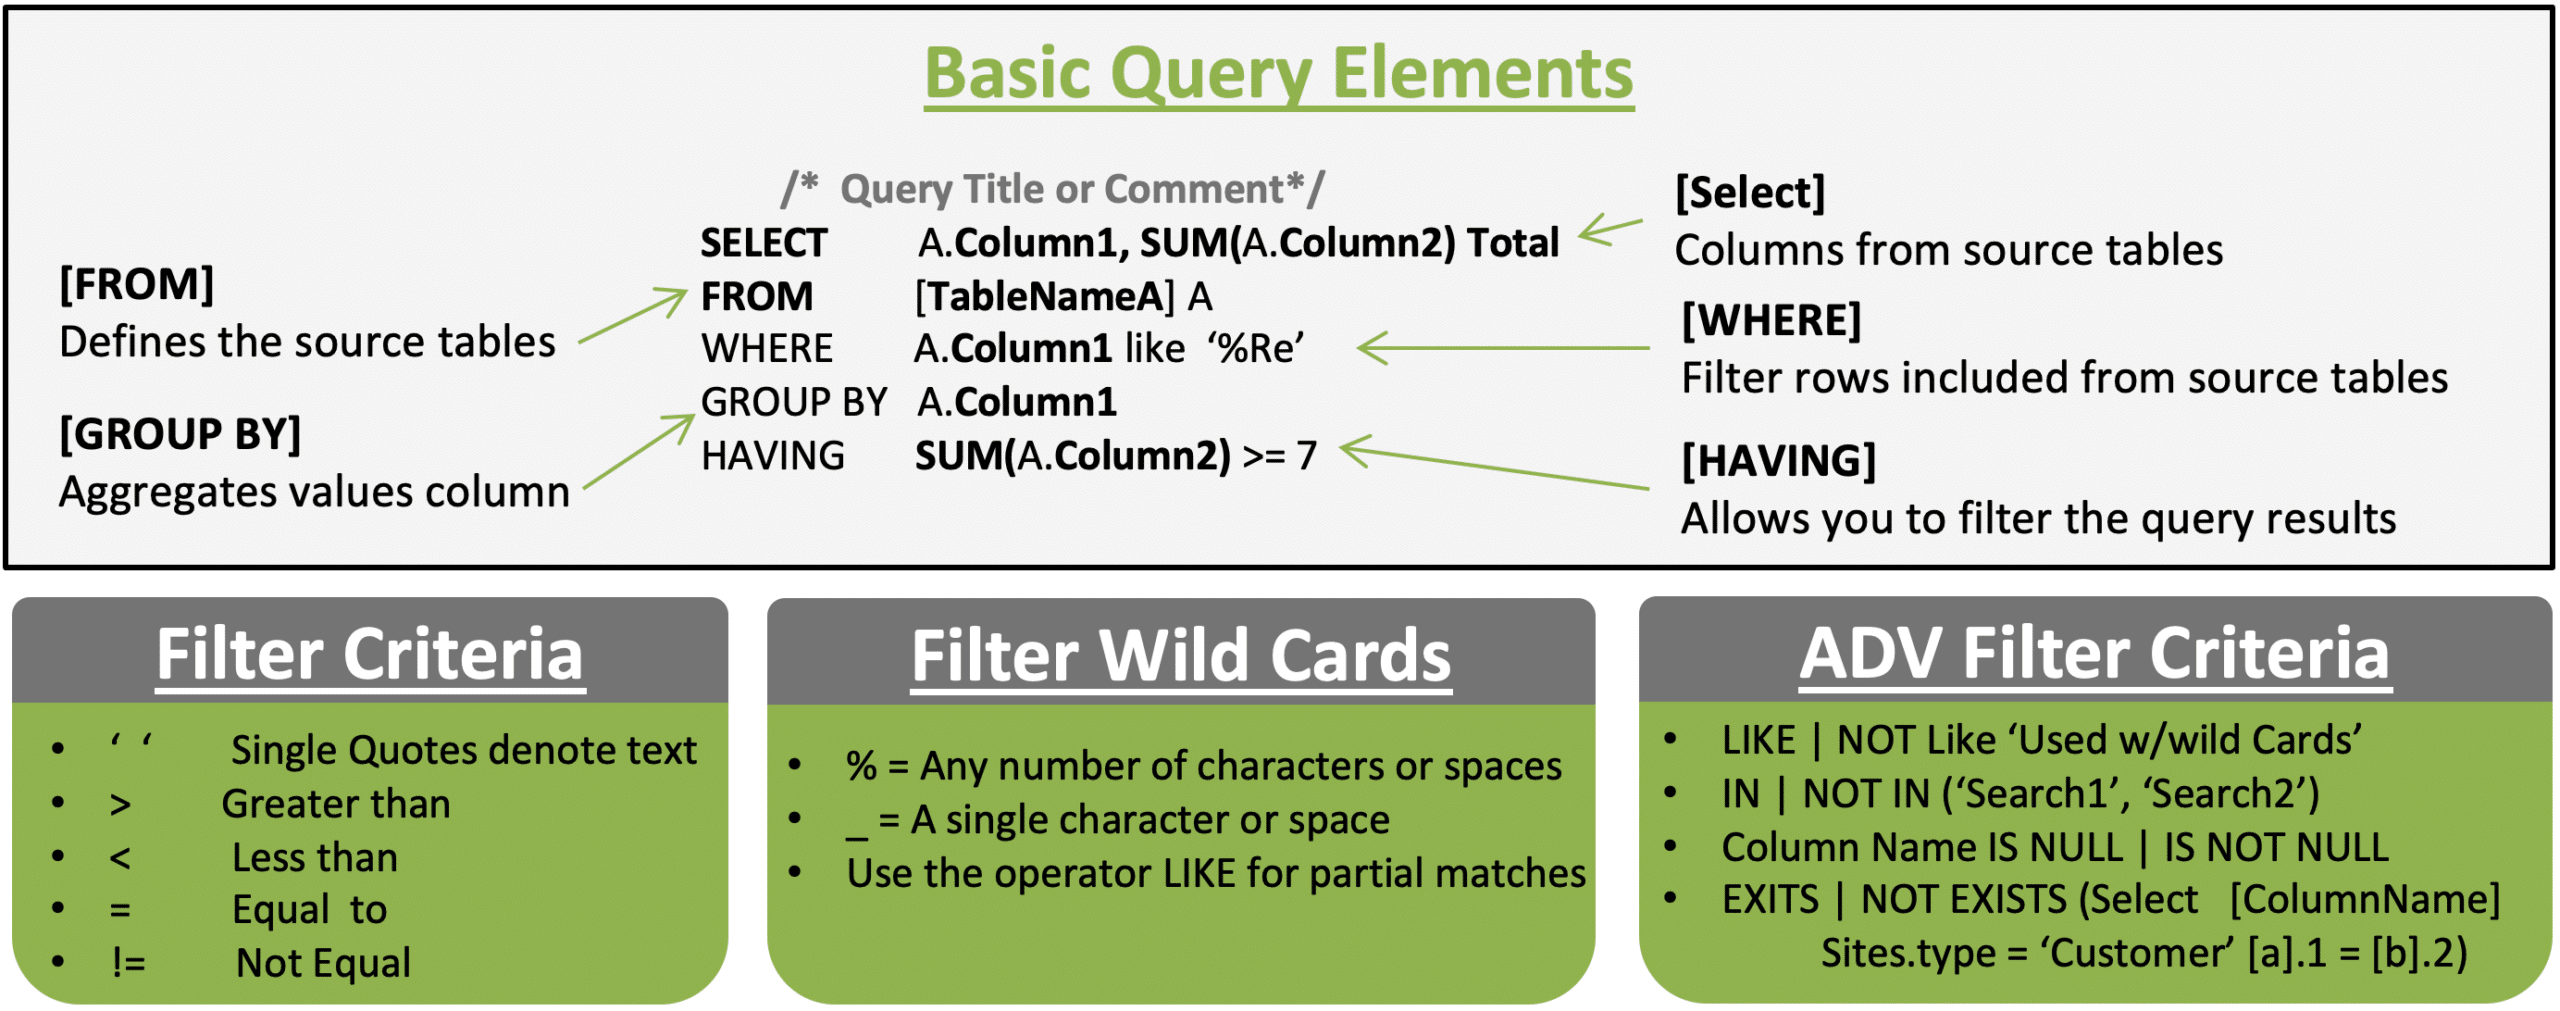
Example 1: Filter Criteria - Customers with status set to include without latitude
SELECT A.CustomerName, A.Status, A.Region
FROM customers A
Where A.Latitude IS NOT NULL and A.Status = ‘Include’
Example 2: Summarizing Records - Regions with 2 or more geocoded customers
SELECT A.Region, A.Status, Count(*) AS Cnt
FROM customers A
Where A.Latitude IS NOT NULL
Group By A.Region, A.Status
Having Count(*) > 1
Order by Cnt DescOften, your model analysis will require you to use data stored in more than one table. To include multiple tables in a single SQL query, you will have to use table joins to list the tables and their relationships.
If you are unsure if all joined values are present in both tables, leverage a Left or Right join to ensure you don’t unintentionally exclude records.
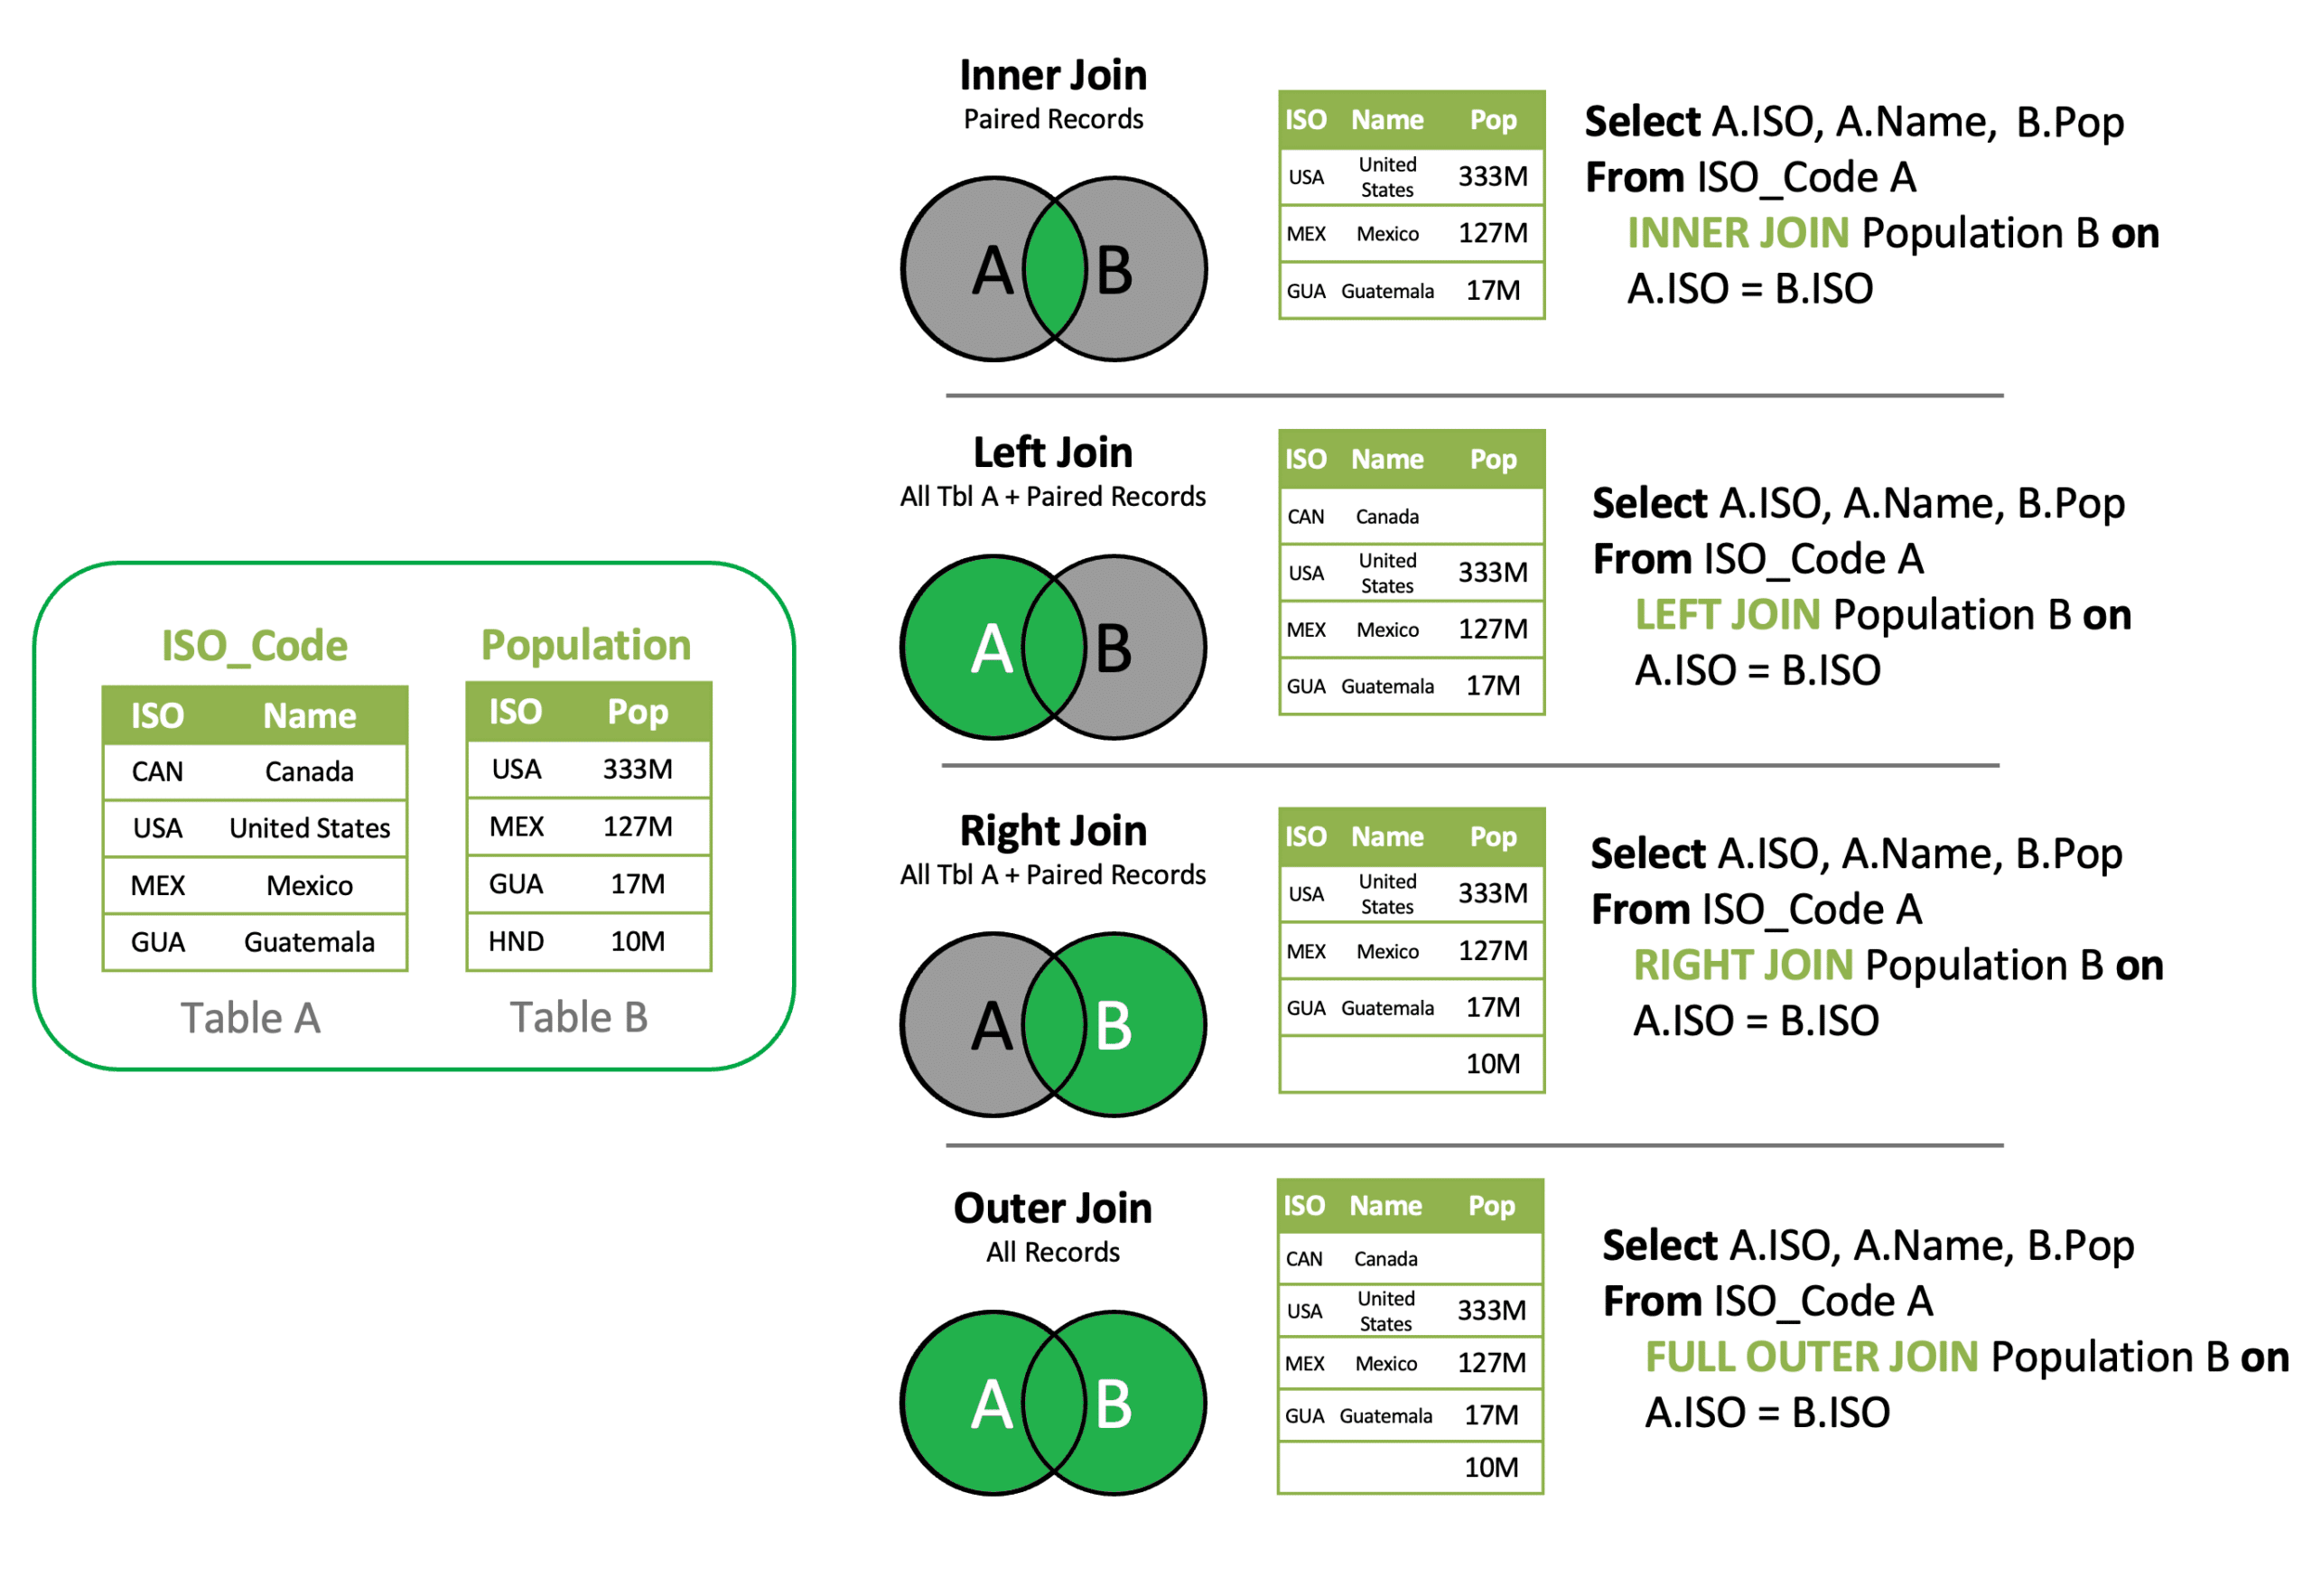
Example 1: Inner Join - Join Customer Demand and Customers to add Region to Demand
SELECT A.CustomerName, A.ProductName, B.Region, A.Quantity
FROM customerdemand A INNER JOIN Customers B
  on A.CustomerName = B.CustomerName
Example 2: Left Join - Find Customer Demand records missing Customer record
SELECT A.CustomerName, A.ProductName, B.Region, A.Quantity
FROM customerdemand A Left JOIN Customers B
  on A.CustomerName = B.CustomerName
Where B.CustomerName is Null
Example 3: Inner Join & Aggregation – Summarize Demand by Region
SELECT B.Region, A.ProductName, SUM(Cast (A.Quantity as Int)) Quantity
FROM customerdemand A INNER JOIN Customers B
  on A.CustomerName = B.CustomerName
Group By B.Region, A.ProductNameWhen data is separated into two or more tables due to categorical differences in the data, a join won’t work because there is a common structure, not a relationship between the tables. A UNION is a type of join that allows you to merge the results of two separate table queries into a single unified output. Ensure each query has the same number of columns in the same order.
Example 1: UNION – Create a unified view of all customers and facilities that are geocoded
SELECT A.CustomerName as SiteName, A.City, A.Region, A.Country, A.Latitude, A.Longitude, 'Cust' as Type
FROM customers A
  UNION
SELECT B.FacilityName as SiteName, B.City, B.Region, B.Country,B.Latitude, B.Longitude, 'Facility' as Type
FROM Facilities BAs queries grow in complexity, it is often easiest to reset the table references by creating a sub-query. A sub-query allows you to create a new virtual table and reference this abbreviated name and structure as you build out a query in phases.
Example 1: Subquery +UNION – Create a unified view of all customers and facilities that are geocoded
SELECT C.SiteName, C.city, C.Region, C.Country, C.Latitude, C.Longitude, C.Type
FROM (
  SELECT A.CustomerName as SiteName, A.City, A.Region, A.Country, A.Latitude, A.Longitude, 'Cust' as Type
  FROM customers A
    UNION
  SELECT B.FacilityName as SiteName, B.City, B.Region, B.Country,B.Latitude, B.Longitude, 'Facility' as Type
  FROM Facilities B
) C
WHERE C.Latitude IS NOT NULLAs data tables grow, it is often more efficient to use a table filter to find missing values than a left join and null filter criteria.
Example 1: Table Search Filter – CustomerDemand without a Customer match
SELECT * FROM customerdemand A
WHERE NOT EXISTS (SELECT B.CustomerName FROM Customers B WHERE A.CustomerName = B.CustomerName)The Analytics module in Cosmic Frog allows you to display data from tables and views. Custom queries can be stored as views, enabling the analytics module to reference this virtual table to display results. Creating a view follows a very similar query construct as a sub-query, but rather than layering in a select statement, you add CREATE VIEW viewname as ( query).
Once created, a view can be selected with the Analytics module of Cosmic Frog.
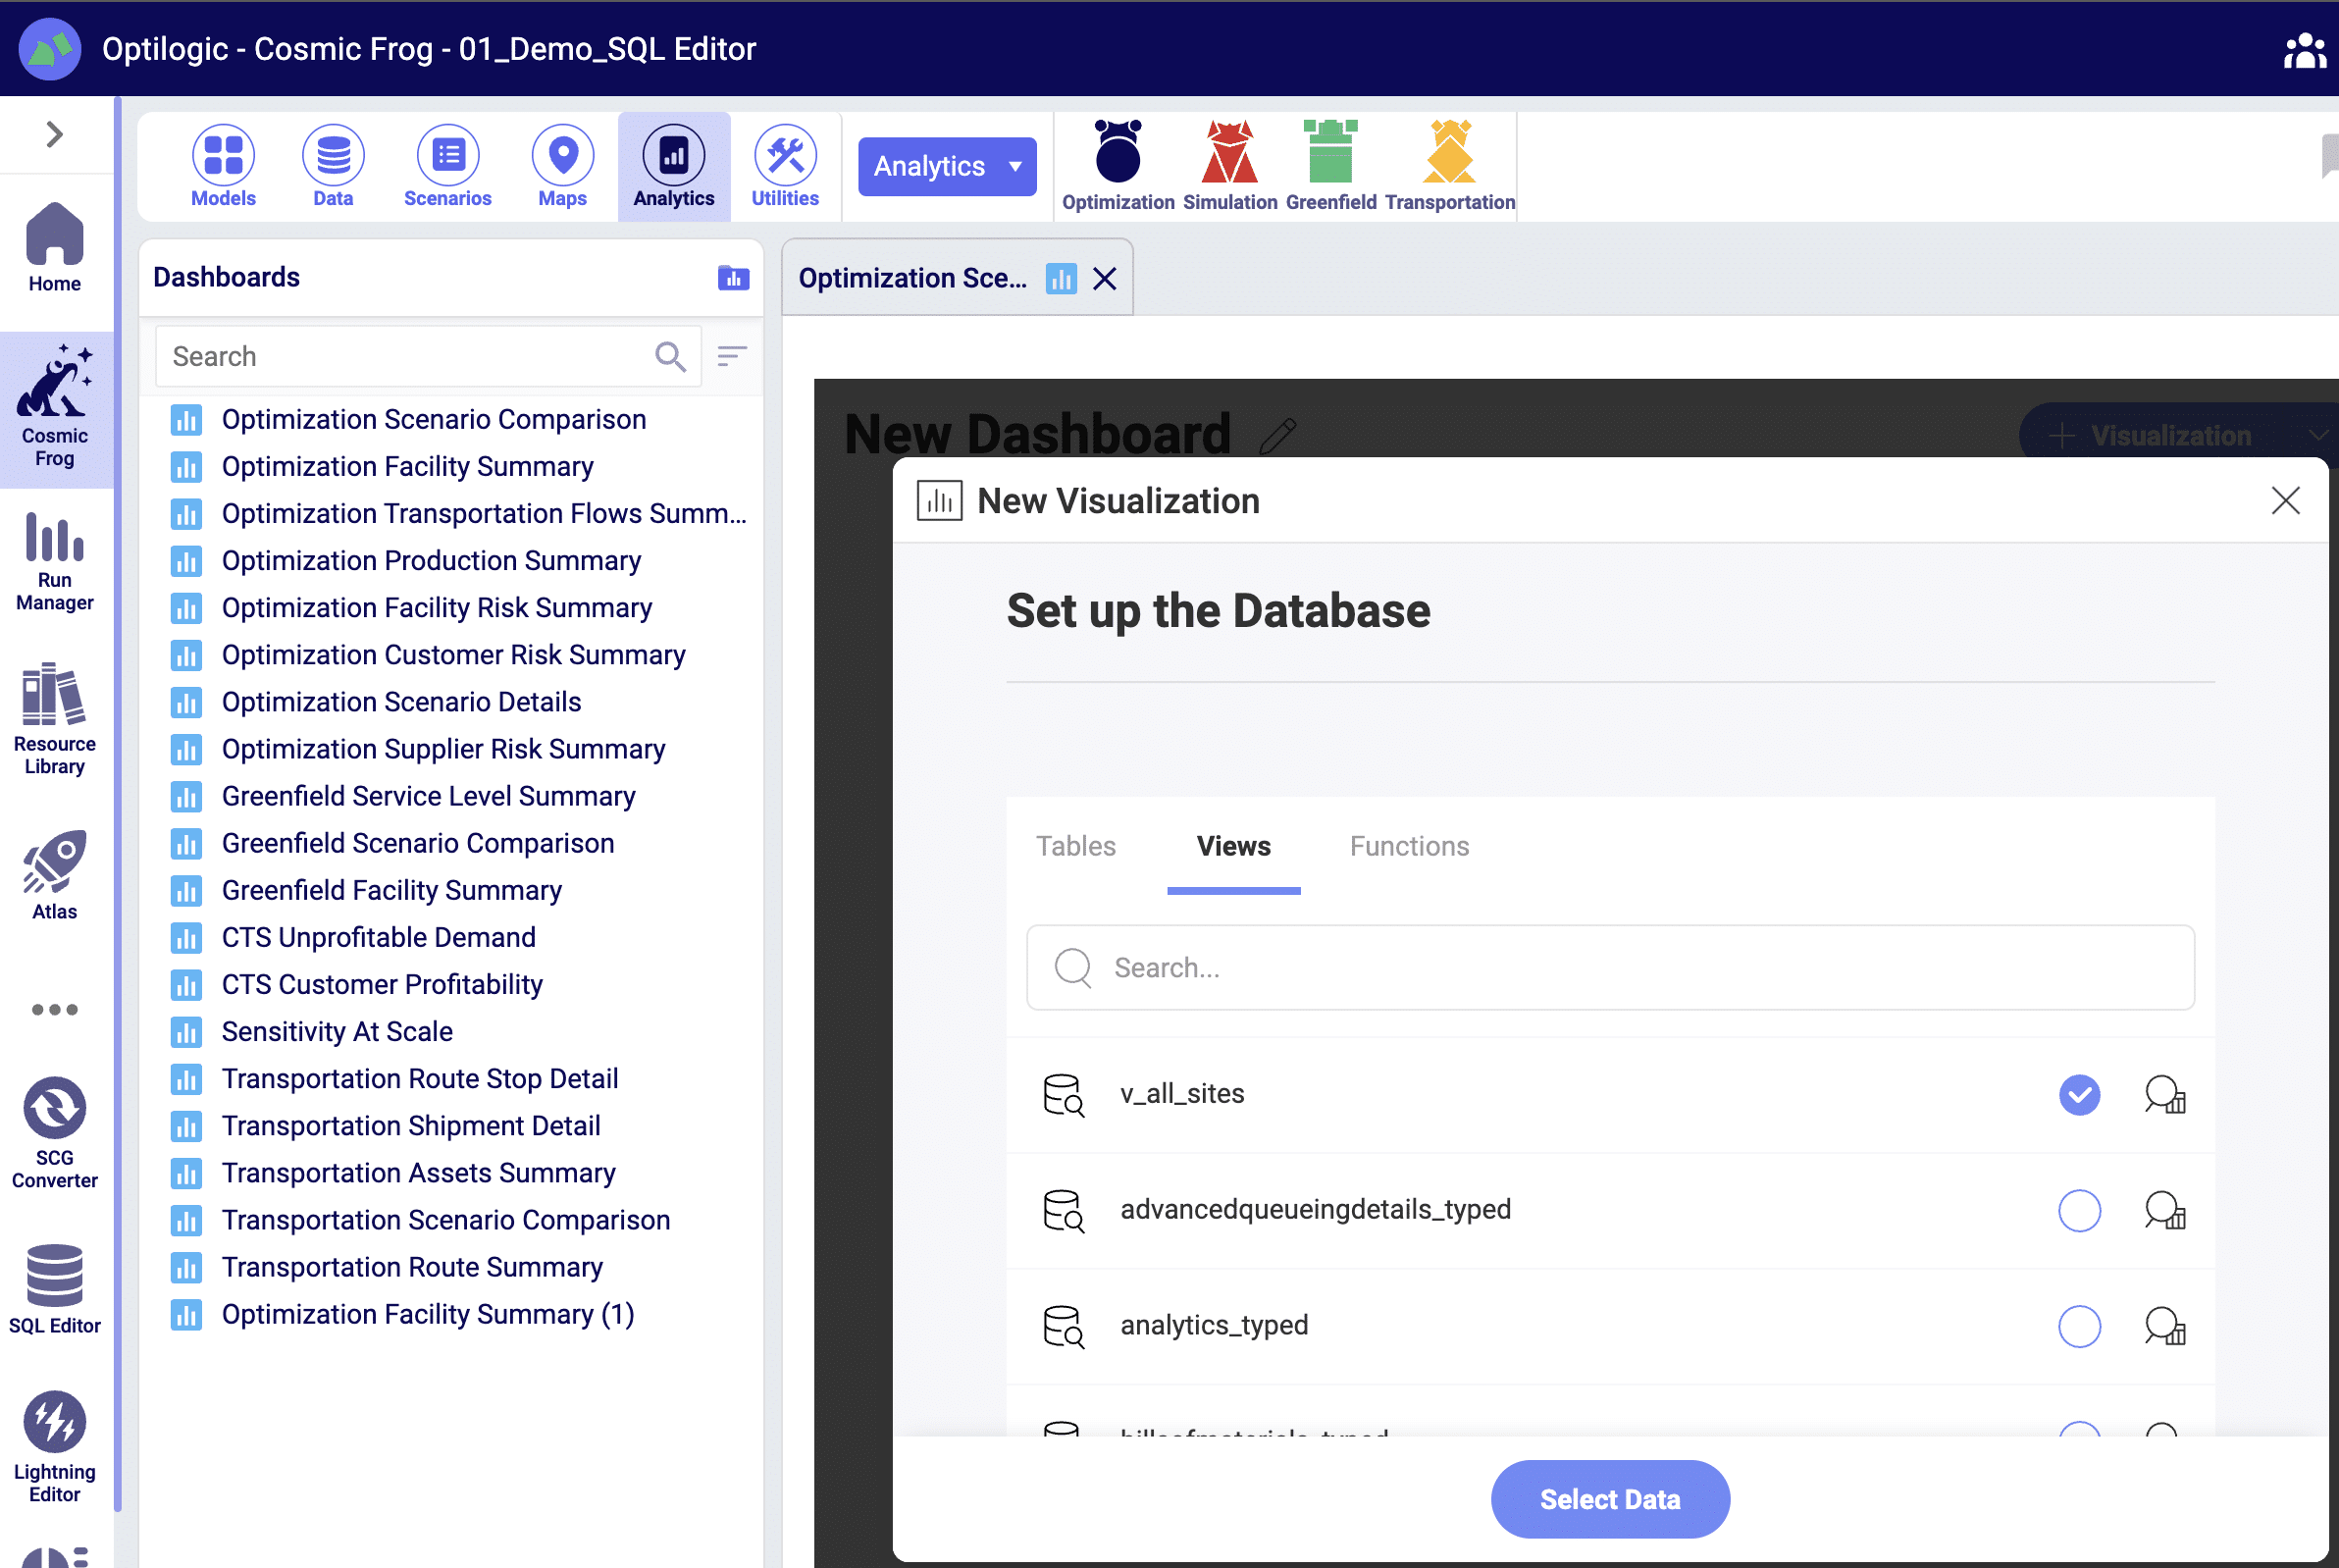
Example 1: Create View – Creating an all-site view
CREATE VIEW V_All_Sites as
(
  SELECT C.SiteName, C.city, C.Region, C.Country, C.Latitude, C.Longitude, C.Type
  FROM (
    SELECT A.CustomerName as SiteName, A.City, A.Region, A.Country, A.Latitude, A.Longitude, 'Cst' as Type
    FROM customers A
      UNION
    SELECT B.FacilityName as SiteName, B.City, B.Region, B.Country,B.Latitude, B.Longitude, 'Fac' as Type
    FROM Facilities B
  ) C
)
Example 2: Delete View – Delete V_all_sites view
Drop VIEW v_all_sitesSQL queries can also modify the contents and structure of data tables. This is a powerful capability, and the results, if improperly applied, cannot be undone.
Table updates & modifications can be completed within Cosmic Frog, with the added benefit of the context of allowed column values. This can also be done within the SQL editor by executing UPDATE and ALTER TABLE SQL statements.
Example 1: Modifying Tables – Adding Additional Notes Columns
ALTER TABLE Customers
ADD Notes_1 character varying (250)
Example 2: Modifying Values – Updating Notes Columns
UPDATE Customers
SET Notes_1 = CONCAT(Country , '-' , Region)
Example 3: Modifying Tables – Delete New Notes Columns
ALTER TABLE Customers
DROP COLUMN Notes_1
Example 4: Copying Tables – Copy Customers Table
SELECT *
INTO Customers_1
FROM Customers
Example 5: Deleting Tables – Delete Customers Table
DROP TABLE Customers_1
DROP TABLE Customers_1
Visit https://www.postgresqltutorial.com/ for more information on PostgreSQL query syntax.
A confirmation email is sent following account creation, however this email could potentially be blocked due to an organization’s IT policies. If you are failing to receive your confirmation email, please make sure that www.optilogic.com is whitelisted, as well as the following email address: support=www.optilogic.com@mail.www.optilogic.com.
If possible, please request that a wildcard whitelist be established for all URL’s that end in *.optilogic.app.
After confirming that these have been whitelisted, try and send another confirmation email. If the problem persists, please send a note in to support@optilogic.com.
One of Cosmic Frog’s great competitive features is the ability to quickly run many sensitivity analysis scenarios in parallel on Optilogic’s Cloud-based platform. This built-in Sensitivity at Scale (S@S) functionality lets a user run sensitivity on demand quantity and transportation costs with 1 click of a button, on any scenario using any of Cosmic Frog’s engines. In this documentation, we will walk through how to kick-off a S@S run, where to track the status of the scenarios, and show some example outputs of S@S scenarios once they have completed running.
Kicking off a S@S analysis is simply done by clicking on the green S@S button on the right-hand side in the toolbar at the top of Cosmic Frog:

After clicking on the S@S button, the Run Sensitivity at Scale screen comes up:
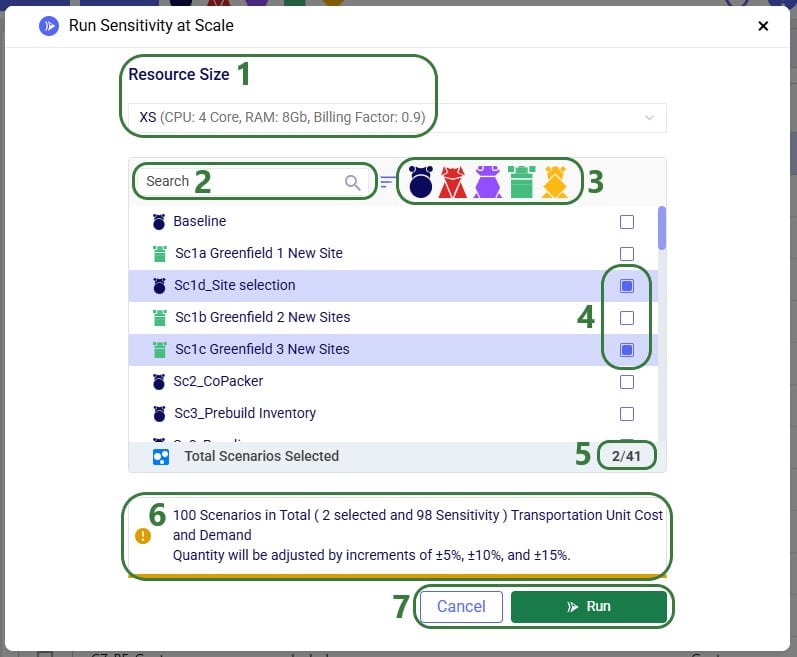
Please note that the parameters that are configured on the Run Settings screen (which comes up when clicking on the Run button at the right top of Cosmic Frog) are used for the Sensitivity at Scale scenario runs.
The scenarios are then created in the model, and we can review their setup by switching to the Scenarios module within Cosmic Frog:
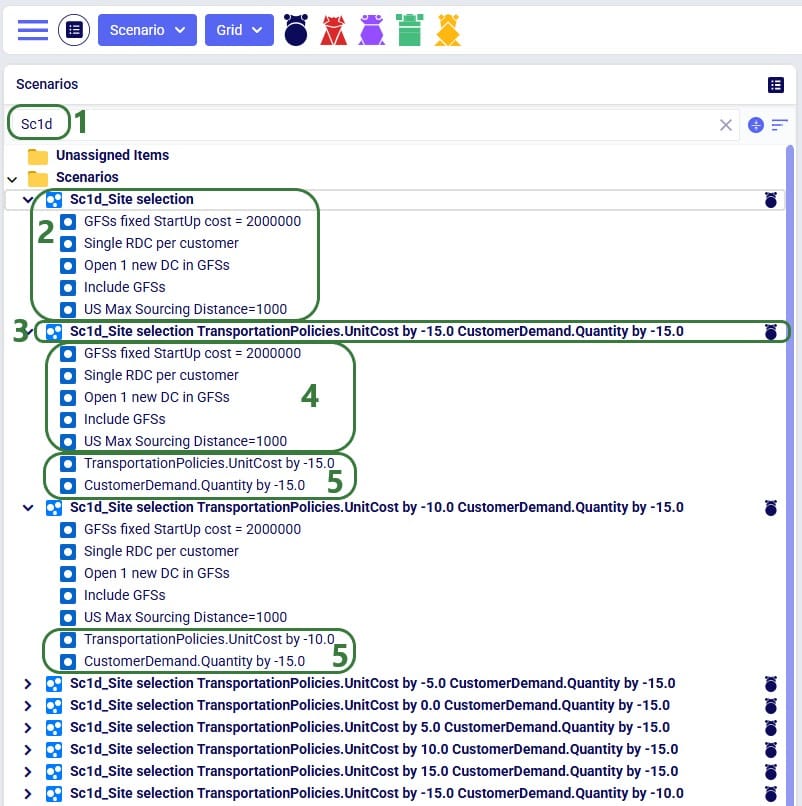
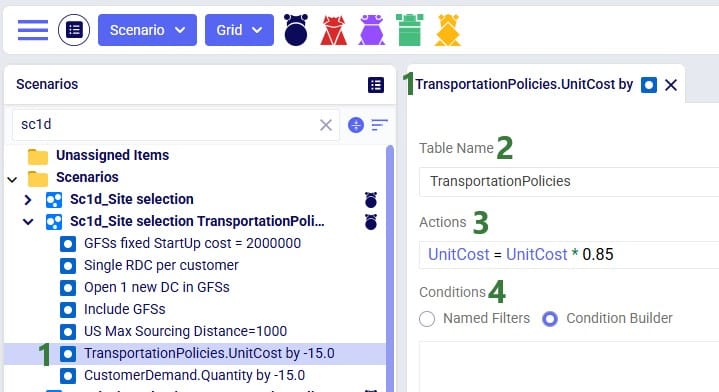
As an example of the sensitivity scenario items that are being created and assigned to the sensitivity scenarios as part of the S@S process, let us have a look at one of these newly created scenario items:
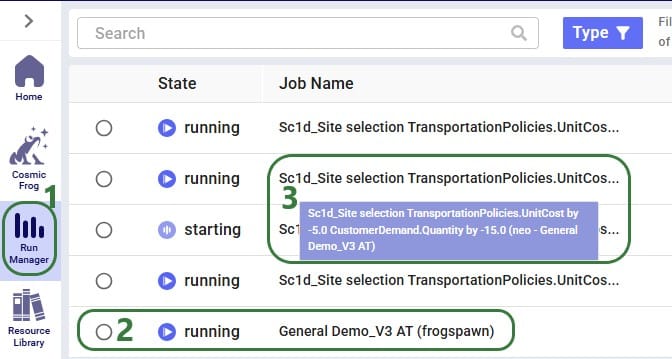
Once the sensitivity scenarios have been created, they are kicked off to all be run simultaneously. Users can have a look in the Run Manager application on the Optilogic platform to track their progress:
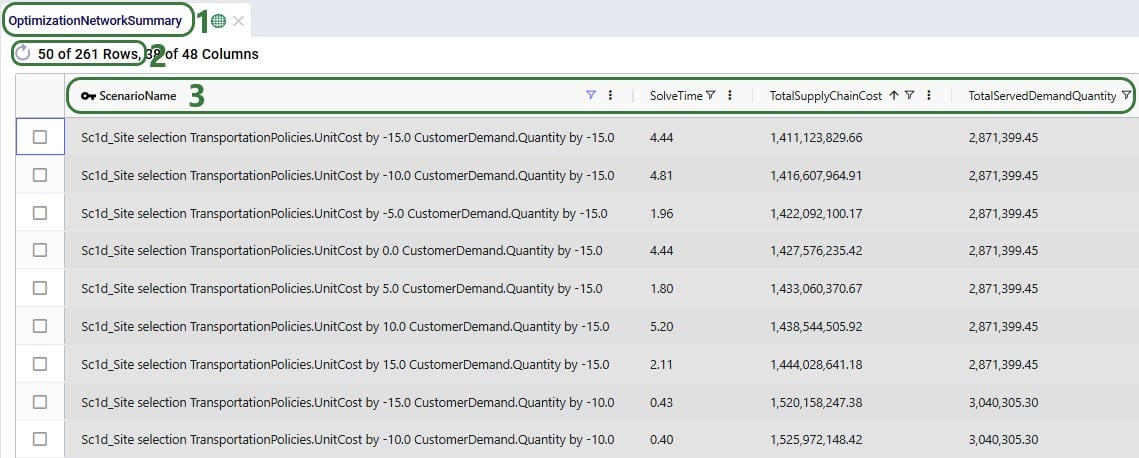
Once a S@S scenario finishes, its outputs are available for review in Cosmic Frog. As with other models and scenarios, users can review outputs through output tables, maps, and graphs/charts/dashboards in the Analytics module. Here we will just show the Optimization Network Summary output table and a cost comparison chart as example outputs. Depending on the model and technology run, users may want to look at different outputs to best understand them.
To understand how the costs are divided over the different cost types and how they compare by scenario, we can look at following Supply Chain Cost Detail graph in the Analytics module:
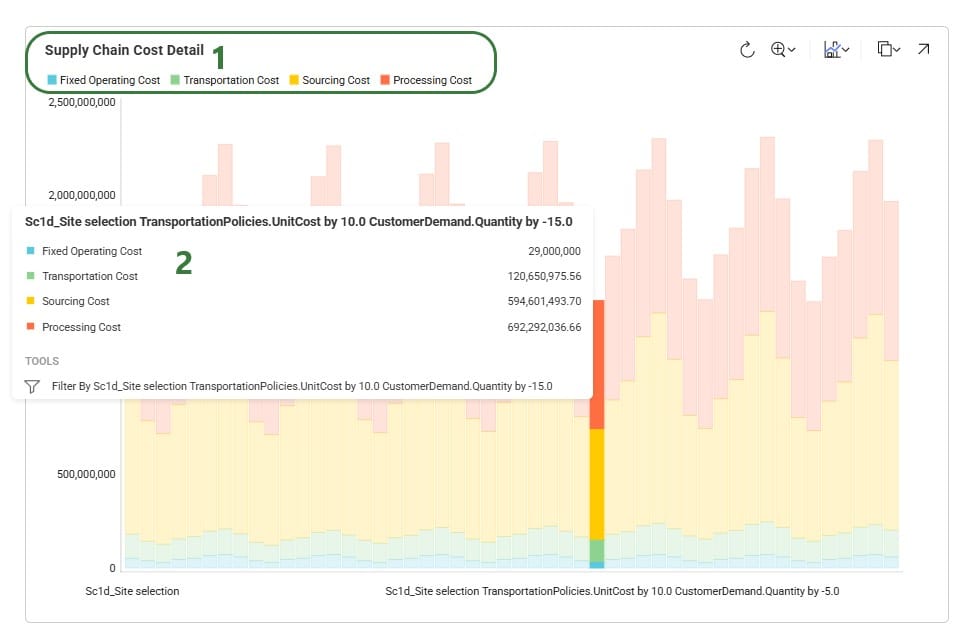
Optimization (NEO) will read from all 5 of input tables in the Sourcing section of Cosmic Frog.
We are able to use these tables to define the sourcing logic that describes costs and where a product can be introduced into the network through production at a Facility (Production Policies) or by way of a Supplier (Supplier Capabilities). We can also define additional rules around how a product must be sourced using the Max Sourcing Range and Optimization Policy fields in the Customer Fulfillment, Replenishment, and Procurement Policies tables.
The Max Sourcing Range field can be used to specify the maximum flow distance allowed for a listed location / product combination. If flow distances are not specified in the Distance field of the Transportation Policies table, a straight-line distance will be calculated based on the Origin / Destination geocoordinates. This will take into account the Circuity Factor specified in the Model Settings as a multiplication factor to estimate real road distances. Any transportation distances that exceed the Max Sourcing Range will result in the arcs being dropped from consideration.
There are 4 allowable entries for Optimization Policy. For any given Destination / Product combination, only a single Optimization Policy entry will be supported meaning you can not have one source listed with a policy of Single Source and another as By Ratio (Auto Scale).
This is the default entry that will be used if nothing is specified. To Optimize places no additional logic onto the sourcing requirement and will use the least cost option available.
For the listed destination / product combination, only one of the possible sources can be selected.
This option allows for sources to be split by the defined ratios that are entered into the Optimization Policy Value field. All of the entries into this Policy Value field will be automatically scaled, and the flow ratios will be followed for all inbound flow to the listed destination / product combination.
For example, there are 3 potential sources for a single Customer location. There is a flow split enforced of 50-30-20 from DC_1, DC_2, DC_3 respectively. This can be entered as Policy Values of 50, 30, and 20:

The same sourcing logic could be achieved by entering values of 5, 3, 2 or even 15, 9, 6. All values will be automatically scaled for each valid source that has been defined for a destination / product combination.
Similar to the Auto Scale option, By Ratio (No Scale) allows for sources to be split by the defined ratios entered into the Optimization Policy Value field. However, no scaling will be performed and the Optimization Policy Value fields will be treated as absolute sourcing percentages where an entry of 50 means that exactly 50% of the inbound flow will come from the listed source.
For example, there are 3 possible sources for a single Customer location and we want to enforce that DC_1 will account for exactly 50% of the flow while the remainder can come from any valid location. We can specify that DC_1 will have a Policy Value of 50 while leaving our other options open for the model to optimize.
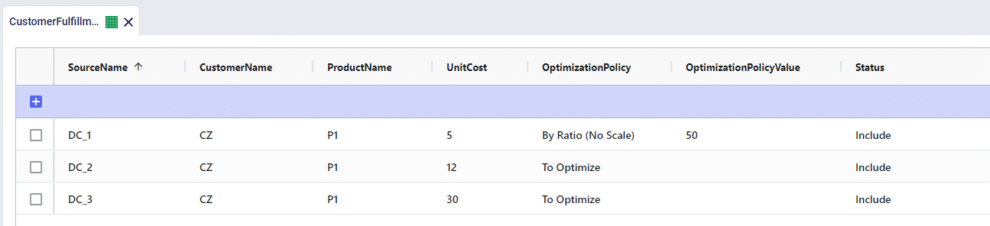
If Policy Values add up to less than 100 for a listed destination / product combination, another sourcing option must be available to fulfill the remaining percentage.
If Policy Values add up to more than 100 for a listed destination / product combination, the percentages will be scaled to 100 and used as the only possible sources.
Cosmic Frog for Excel Applications provide alternative interfaces for specific use cases as companion applications to the full Cosmic Frog Supply chain design product. For example, they can be used to access a subset of the Cosmic Frog functionality in a simplified manner or provide specific users who are not experienced in working with Cosmic Frog models access to a subset of inputs and/or outputs of a full-blown Cosmic Frog model that are relevant to their position.
Several example use cases are:
It is recommended to review the Cosmic Frog for Excel App Builder before diving into this documentation, as basic applications can quickly and easily be built with it rather than having to edit/write code, which is what will be explained in this help article. The Cosmic Frog for Excel App Builder can be found in the Resource Library and is also explained in the “Getting Started with the Cosmic Frog for Excel App Builder” help article.
Here we will discuss how one can set up and use a Cosmic Frog for Excel Application, which will include steps that use VBA (Visual Basic for Applications) in Excel and scripting using the programming language Python. This may sound daunting at first if you have little or no experience using these. However, by following along with this resource and the ones referenced in this document, most users will be able to set up their own App in about a day or 2 by copy-pasting from these resources and updating the parts that are specific to their use case. Generative AI engines like Chat GPT and perplexity can be very helpful as well to get a start on VBA and Python code. Cosmic Frog functionality will not be explained much in this documentation, the assumption is that users are familiar with the basics of building, running, and analyzing outputs of Cosmic Frog models.
In this documentation we are mainly following along with the Greenfield App that is part of the Resource Library resource “Building a Cosmic Frog for Excel Application”. Once we have gone through this Greenfield app in detail, we will discuss how other common functionality that the Greenfield App does not use can be added to your own Apps.
There are several Cosmic Frog for Excel Applications that have been developed by Optilogic available in the Resource Library. Links to these and a short description of each of them can be found in the penultimate section “Apps Available in the Resource Library” of this documentation.
Throughout the documentation links to other resources are included; in the last section “List of All Resources” a complete list of all resources mentioned is provided.
The following screenshot shows at a high-level what happens when a typical Cosmic Frog for Excel App is used. The left side represents what happens in Excel, and on the right side what happens on the Optilogic platform.
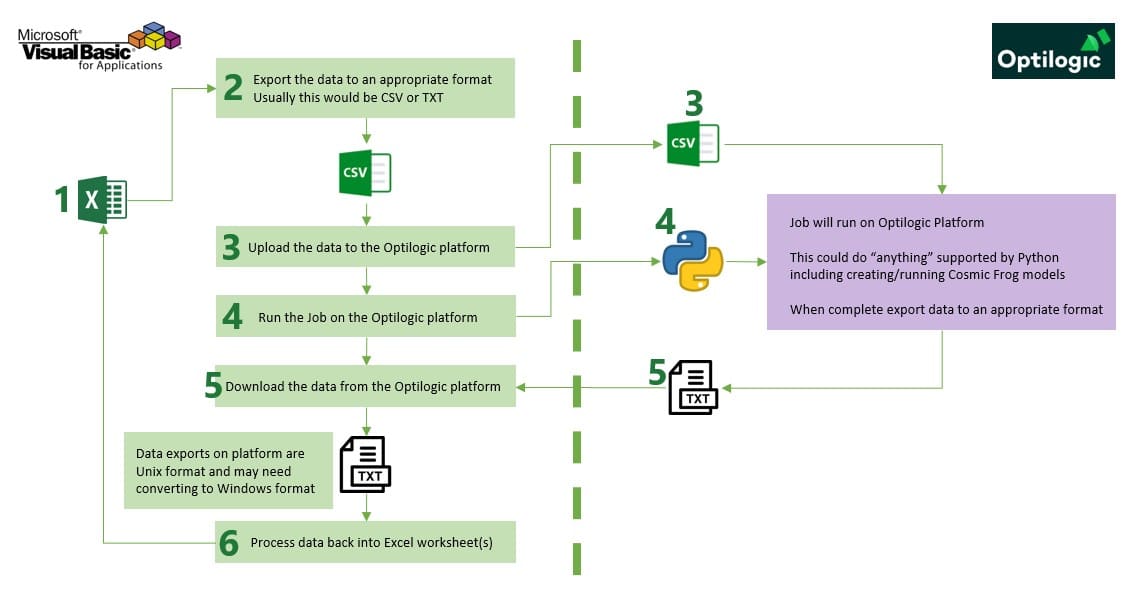
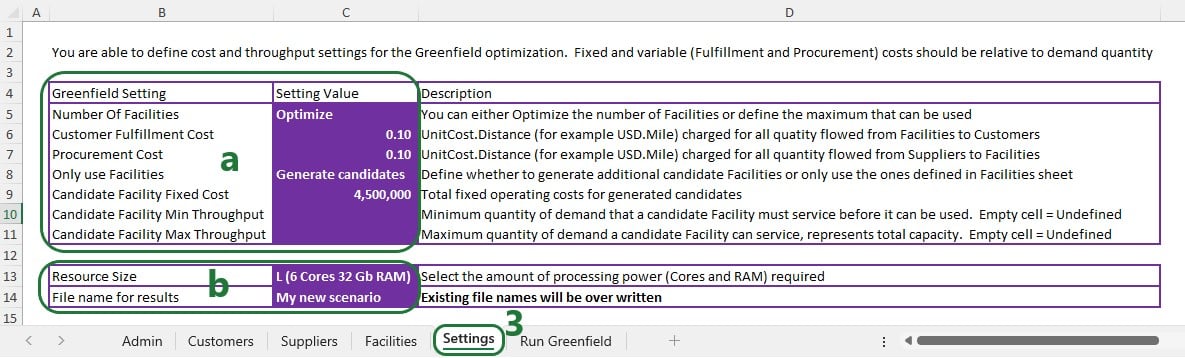
A typical Cosmic Frog for Excel Application will contain at least several worksheets that each serve a specific purpose. As mentioned before, we are using the MicroAPP_Greenfield_v3.xlsm App from the Building a Cosmic Frog for Excel Application resource as an example. The screenshots in this section are of this .xlsm file. Depending on the purpose of the App, users will name and organize worksheets differently, and add/remove worksheets as needed too:
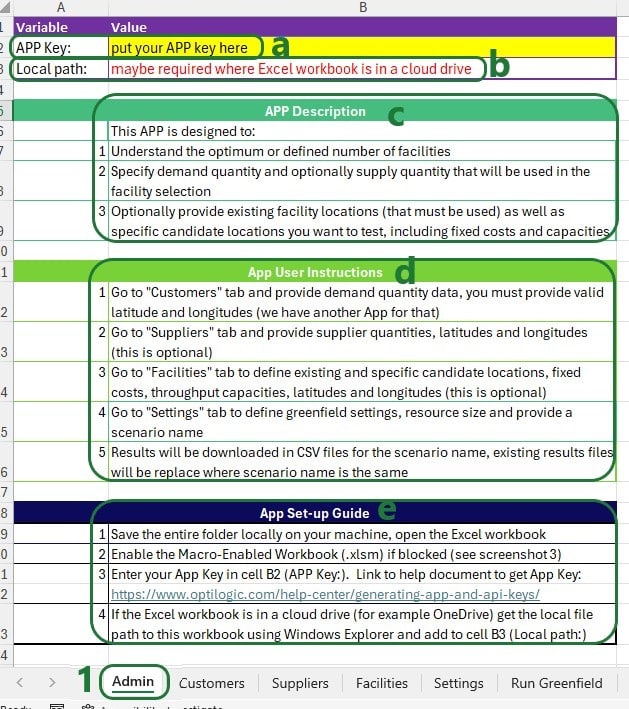


To set up and configure Cosmic Frog for Excel Applications, we mostly use .xlsm Excel files, which are macro-enabled Excel workbooks. When opening an .xlsm file that for example has been shared with you by someone else or has been downloaded from the Optilogic Resource Library (Help Article on How To Use the Resource Library), you may find that you see either a message about a Protected View where editing needs to be enabled or a Security Warning that Macros have been disabled. Please see the Troubleshooting section towards the end of this documentation on how to resolve these warnings.
To set up Macros using Visual Basic for Applications (VBA), go to the Developer tab of the Excel ribbon:
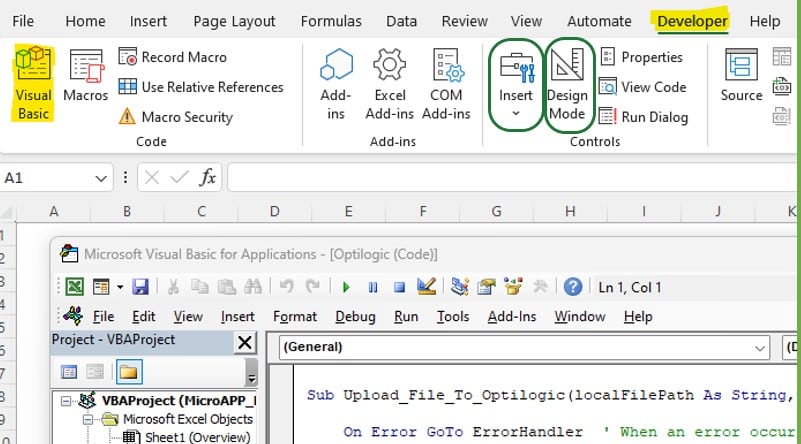
If the Developer option is not available in the ribbon, then go to File > Options > Customize Ribbon, select Developer from the list on the left and click on the Add >> button, then click on OK. Should you not see Options when clicking on File, then click on “More…” instead, which will then show you Options too.
Now that you are set up to start building Macros using VBA: go to the Developer tab, enable Design Mode and add controls to your sheets by clicking on Insert, and selecting any controls to insert from the drop-down menu. For example, add a button and assign a Macro to it by right clicking on the button and selecting Assign Macro from the right-click menu:

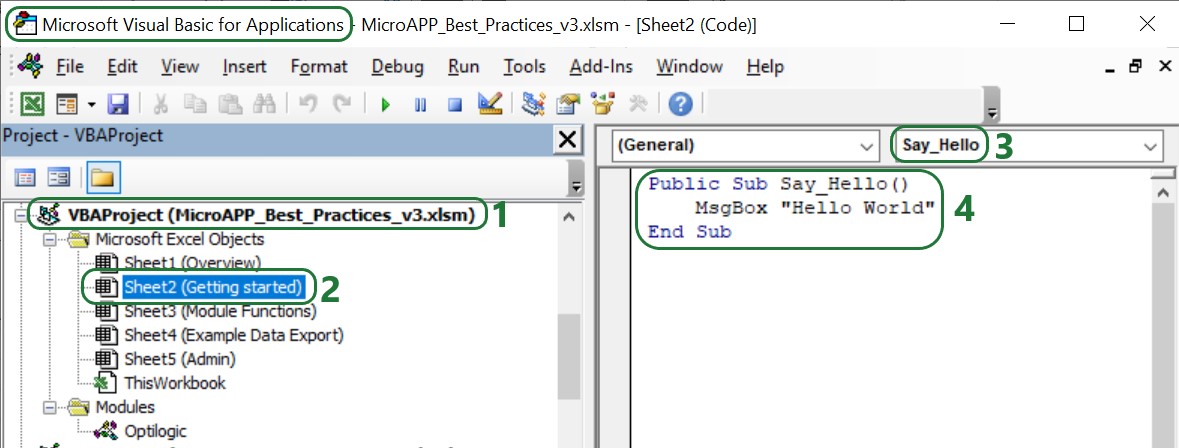
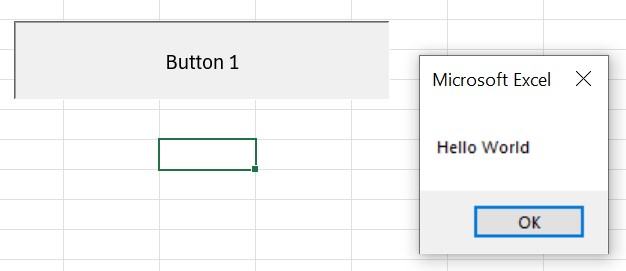
To learn more about Visual Basic for Applications, see this Microsoft help article Getting started with VBA in Office, it also has an entire section on VBA in Excel.
It is possible to add custom modules to VBA in which Sub procedures (“Subs”) and functions to perform specific tasks have been pre-defined and can be called in the rest of the VBA code used in the workbook where the module has been imported into. Optilogic has created such a module, called Optilogic.bas. This module provides 8 standard functions for integration into the Optilogic platform.
You can download Optilogic.bas from the Building a Cosmic Frog for Excel Application resource in the Resource Library:
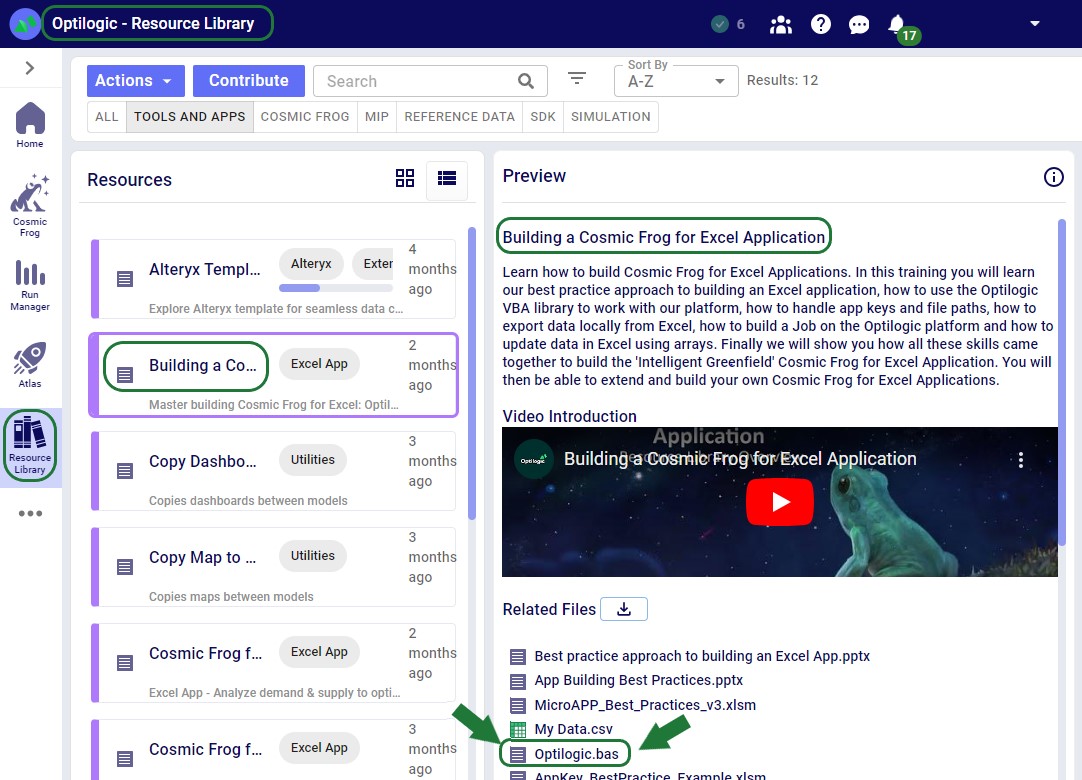
You can then import it into the workbook you want to use it in:
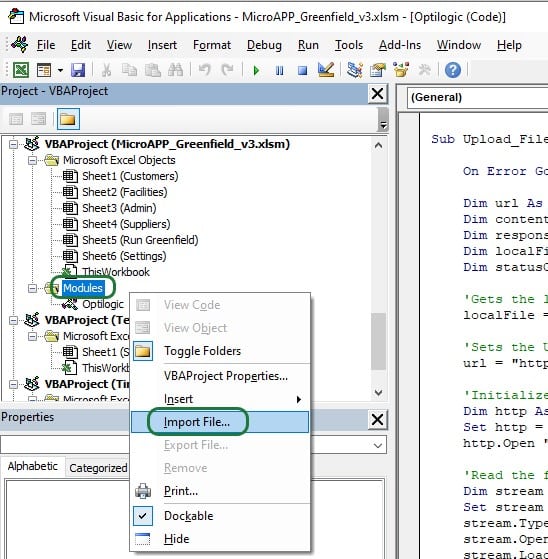
Right click on Modules in the VBA Project of the workbook you are working in and then select Import File…. Browse to where you have saved Opitlogic.bas and select it. Once done, it will appear in the Modules section, and you can double click on it to open it up:

These Optilogic specific Sub procedures and the standard VBA for Excel functionality enable users to create the Macros they require for their Cosmic Frog for Excel Applications.
App Keys are used to authenticate the user from the Excel App on the Optilogic platform. To get an App Key that you can enter into your Excel Apps, see this Help Center Article on Generating App and API Keys. During the first run of an App, the App Key will be copied from the cell it is entered into to an app.key file in the same folder as the Excel .xlsm file, and it will be removed from the worksheet. This is done by using the Manage_App_Key Sub procedure described in the “Optilogic.bas VBA Module” section above. User can then keep running the App without having to enter the App Key again unless the workbook or app.key file is moved elsewhere.
It is important to emphasize that App Keys should not be saved into Excel Apps as they can easily be accidentally shared when the Excel App itself is shared. Individual users need to authenticate with their own App Key.
When sharing an App with someone else, one easy way to do so is to share all contents of the folder where the Excel App is saved (optionally, zipped up). However, one needs to make sure to remove the app.key file from this folder before doing so.
A Python Job file in the context of Cosmic Frog for Excel Applications is the file that contains the instructions (in Python script format) for the operations of the App that take place on the Optilogic Platform.
Notes on Job files:
For Cosmic Frog for Excel Apps, a .job file is typically created and saved in the same folder as the Macro-enabled Excel workbook. As part of the Run Macro in that Excel workbook, the .job file will be uploaded to the Optilogic platform too (together with any input & settings data). Once uploaded, the Python code in the .job file will be executed, which may do things like loading the data from any uploaded CSV files into a Cosmic Frog model, run that Cosmic Frog model (a Greenfield run in our example), and retrieve certain outputs of interest from the Cosmic Frog model once the run is done.
For a Python job that uses functionality from the cosmicfrog library to run, a requirements.txt file that just contains the text “cosmicfrog” (without the quotes) needs to be placed in the same folder as the .job file. Therefore, this file is typically created by the Excel Macro and uploaded together with any exported data & settings worksheets, the app.key file, and the .job file itself so they all land in the same working folder on the Optilogic platform. Note that the Optilogic platform will soon be updated so that using a requirements.txt file will not be needed anymore and the cosmicfrog library will be available by default.
Like VBA, users and creators of Cosmic Frog for Excel Apps do not need to be experts in Python code, and will mostly be able to do the things they want to by copy-pasting from existing Apps and updating only the parts that are different for their App. In the greenfield.job section further below we will go through the code of the python Job for the Greenfield App in more detail, which can be a starting point for users to start making changes to for their own Apps. Next, we will provide some more details and references to quickly equip you with some basic knowledge, including what you can do with the cosmicfrog Python library.
There are a lot of helpful resources and communities online where users can learn everything there is to know about using & writing Python code. A great place to start is on the Python for Beginners page on python.org. This page also mentions how more experienced coders can get started with Python.
Working locally on any Python scripts/Jobs has the advantage that you can make use of code completion features which helps with things like auto-completion, showing what arguments functions need, catch incorrect syntax/names, etc. An example set up to achieve this is for example one where Python, Visual Studio Code, and an IntelliSense extension package for Python for Visual Studio Code are installed locally:
Once you are set up locally and are starting to work with Python files in Visual Studio Code, you will need to install the pandas and cosmicfrog libraries to have access to their functionality. You do this by typing following in a terminal in Visual Studio Code:
More experienced users may start using additional Python libraries in their scripts and will need to similarly install them when working locally to have access to their functionality.
If you want to access items on the Optilogic platform (like Cosmic Frog models) while working locally, you will likely need to whitelist your IP address on the platform, so the connections are not blocked by a firewall. You can do this yourself on the Optilogic platform:
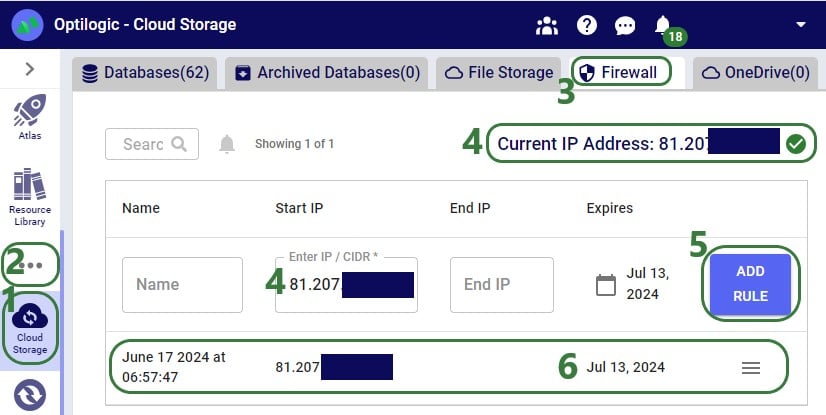
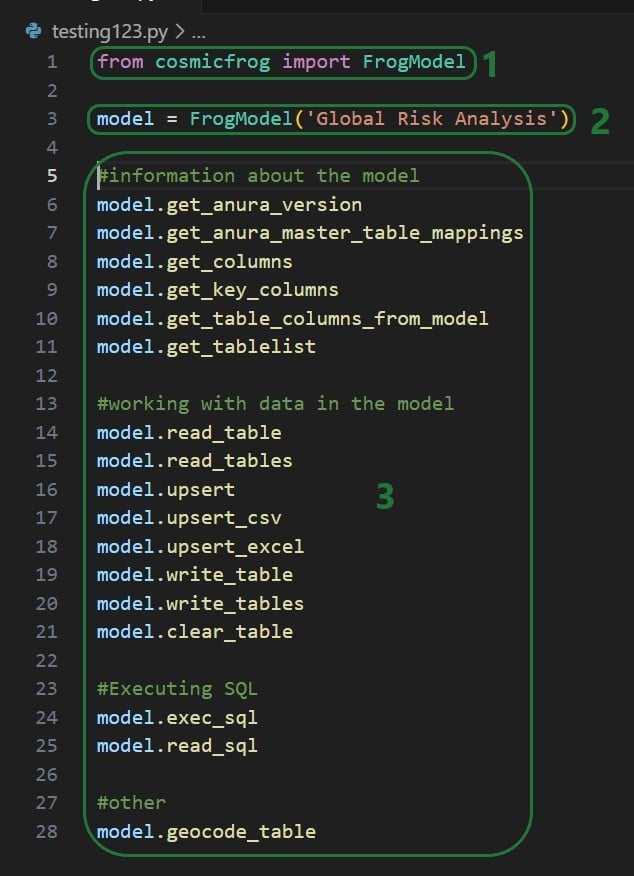
A great resource on how to write Python scripts for Cosmic Frog models is this “Scripting with Cosmic Frog” video. In this video, the cosmicfrog Python library, which adds specific functionality to the existing Python features to work with Cosmic Frog models, is covered in some detail already. The next set of screenshots will show an example using a Python script named testing123.py on our local set-up. The first screenshot shows a list of functions available from the cosmicfrog Python library:
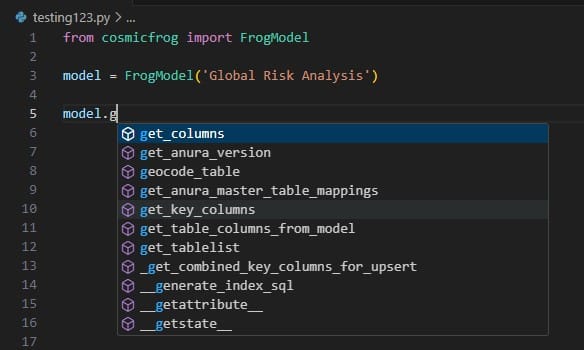
When you continue typing after you have typed “model.” the code completion feature will auto-generate a list of functions you may be getting at. In the next screenshot ones that start with or contain a “g” as I have only typed a “g” so far. This list will auto-update the more you type. You can select from the list with your cursor or arrow up/down keys and hitting the Tab key to auto-complete:
When you have completed typing the function name and next type a parenthesis ‘(‘ to start entering arguments, a pop-up will come up which contains information about the function and its arguments:
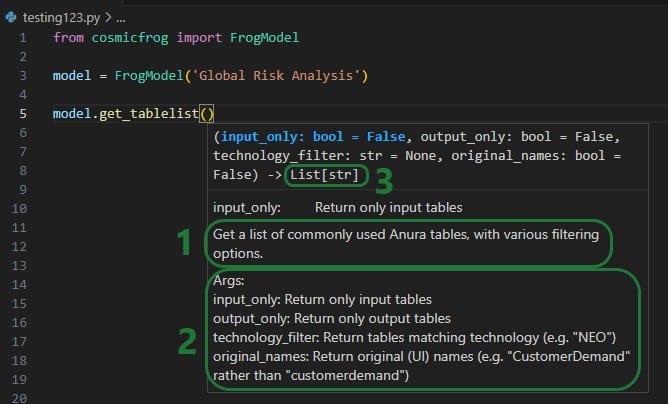
As you type the arguments for the function, the argument that you are on and the expected format (e.g. bool for a Boolean, str for string, etc.) will be in blue font and a description of this specific argument appears above the function description (e.g. above box 1 in the above screenshot). In the screenshot above we are on the first argument input_only which requires a Boolean as input and will be set to False by default if the argument is not specified. In the screenshot below we are on the fourth argument (original_names) which is now in blue font; its default is also False, and the argument description above the function description has changed now to reflect the fourth argument:
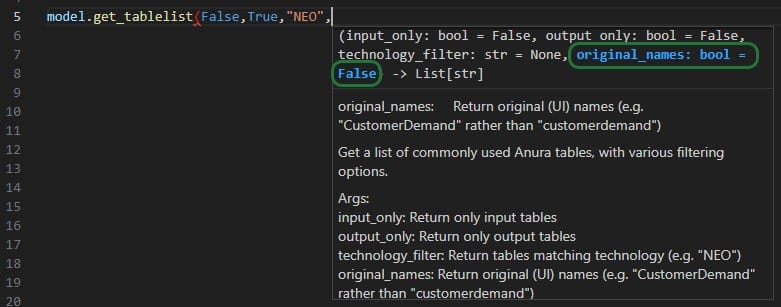
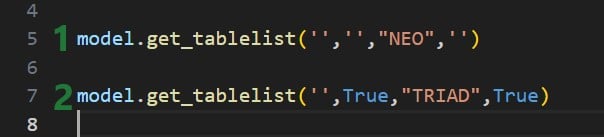
The next screenshot shows 2 examples of using the get_tablelist function of the FrogModel module:
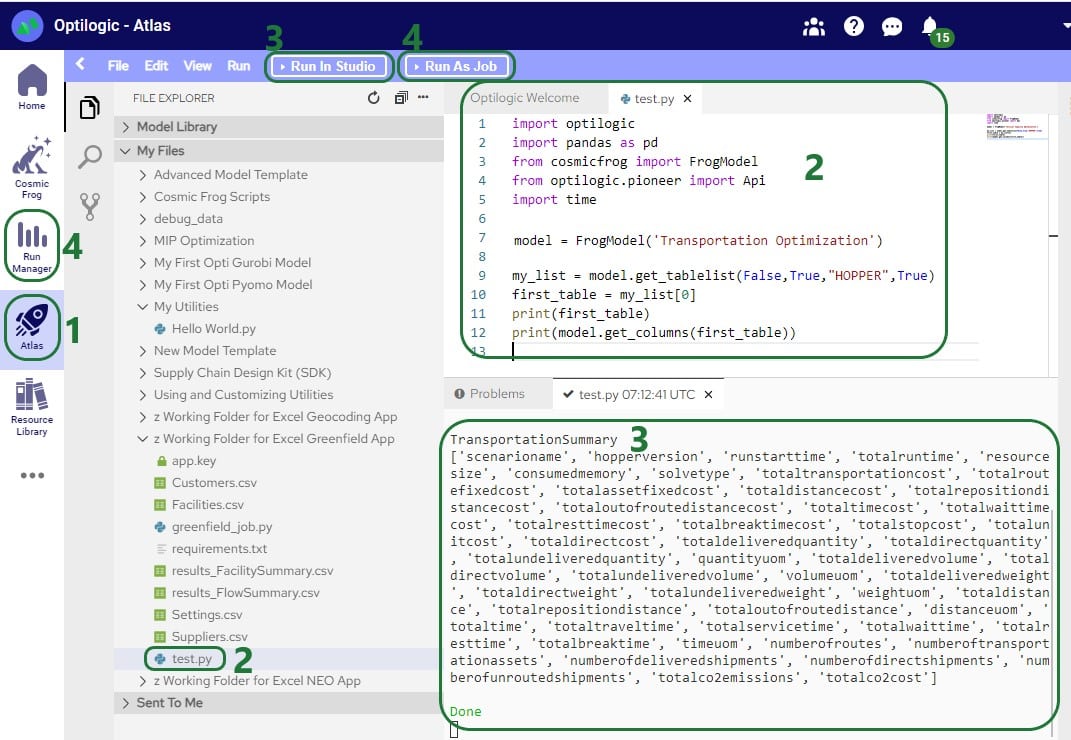
As mentioned above, you can also use Atlas on the Optilogic platform to create and run Python scripts. One drawback here is that it currently does not have code completion features like IntelliSense in Visual Studio Code.
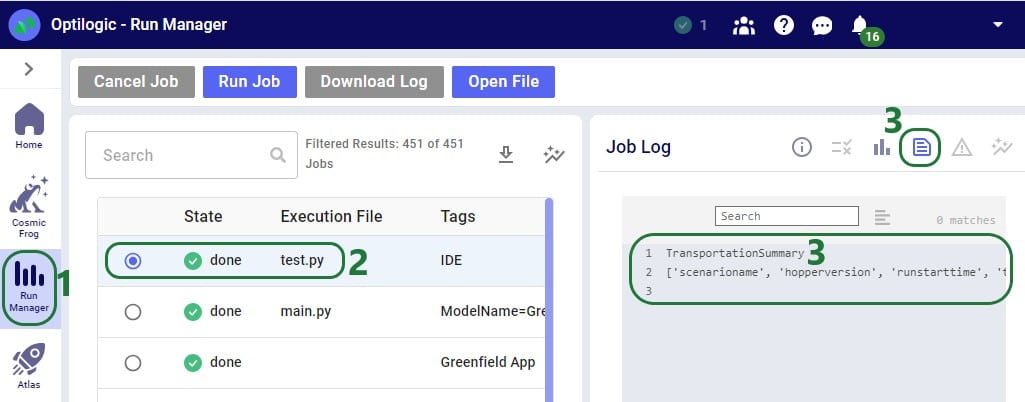
The following simple test.py Python script on Atlas will print the first Hopper output table name and its column names:
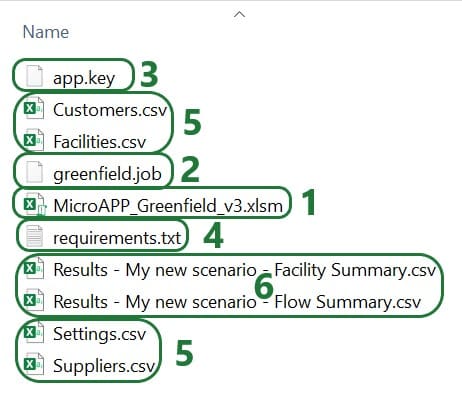
After running the Greenfield App, we can see the following files together in the same folder on our local machine:
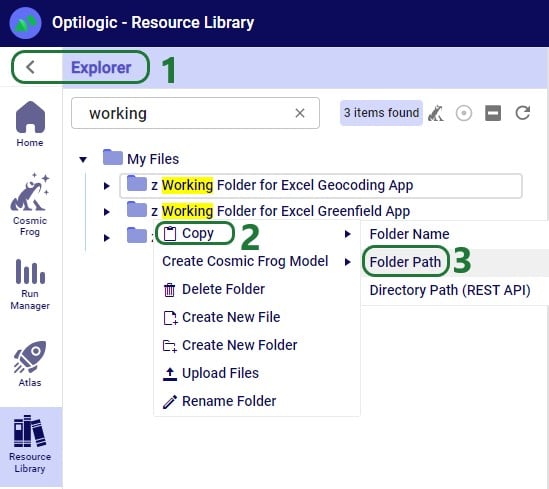
On the Optilogic platform, a working folder is created by the Run Greenfield Macro. This folder is called “z Working Folder for Excel Greenfield App”. After running the Greenfield App, we can see following files in here:
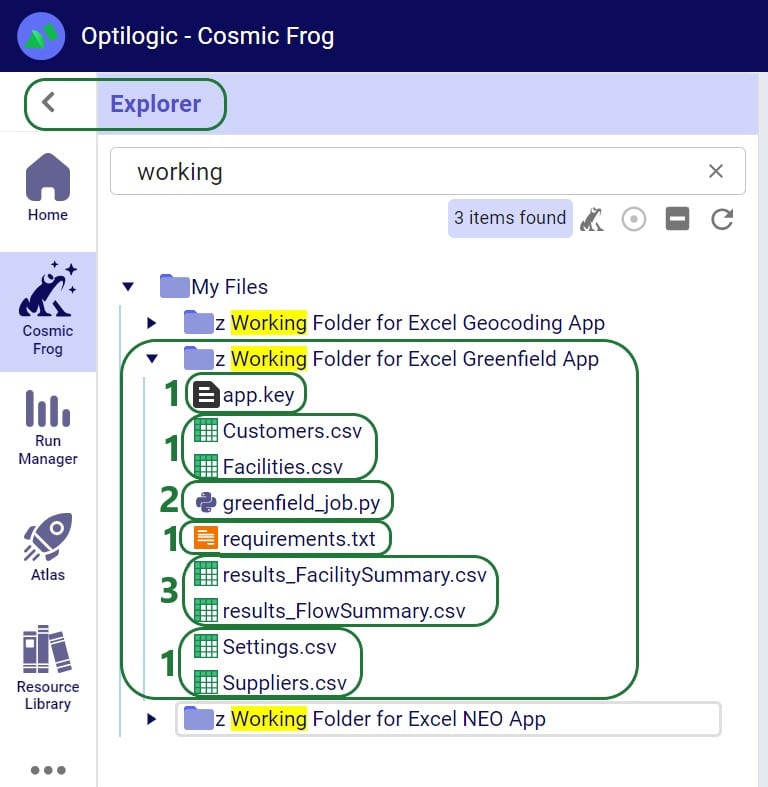
Parts of the Excel Macro and Python .job file will be different from App to App based on the App’s purpose, but a lot of the content will be the same or similar. In this section we will step through the Macro that is behind the Run Greenfield button in the Cosmic Frog for Excel Greenfield App that is included in the “Building a Cosmic Frog for Excel Application” resource, where it will be explained what is happening at a high level each step of the way and mention if this part is likely to be different and in need of editing for other Apps or if it would typically stay the same across most Apps. After stepping through this Excel Macro in this section, we will the same for the Greenfield.job file in the next section.
The next screenshot shows the first part of the VBA code of the Run Greenfield Macro:

Note that throughout the Macro you will see text in green font. These are comments to describe what the code is doing and are not code that is executed when running the Macro. You can add comments by simply starting the line with a single quote and then typing your comment. Comments can be very helpful for less experienced users to understand what the VBA code is doing.
Next, the file path to the workbook is retrieved:
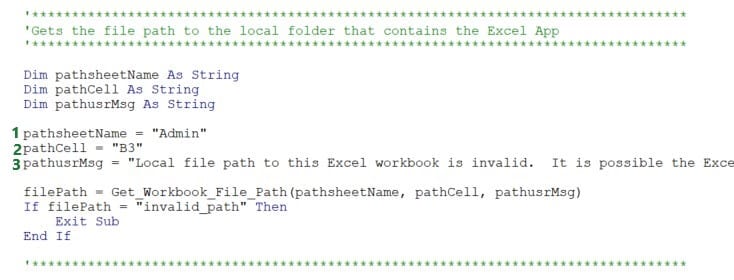
This piece of code uses the Get_Workbook_File_Path function of the Optilogic.bas VBA module to get the file path of the current workbook. This function first tries to get the path without user input. If it finds that the path looks like the Excel workbook is stored online in for example a Cloud folder, it will use user input in cell B3 on the Admin worksheet to get the file path instead. Note that specifying the file path is not necessary if the App runs fine without it, which means it could get the path without the user input. Only if user gets the message “Local file path to this Excel workbook is invalid. It is possible the Excel workbook is in a cloud drive, or you have provided an invalid local path. Please review setup step 4 on Admin sheet.”, the local file path should be entered into cell B3 on the Admin worksheet.
This code can be left as is for other Apps if there is an Admin worksheet (the variable pathsheetName indicated with 1 in screenshot above) where in cell B3 the file path (the variable pathCell indicated with 2 in screenshot above) can be specified. Of course, the worksheet name and cell can be updated if these are located elsewhere in the App. The message the user gets in this case (set as pathusrMsg indicated with 3 in the screenshot above) may need to be edited accordingly too.
The following code takes care of the App Key management:

The Manage_App_Key function from the Optilogic.bas VBA module is used here to retrieve the App Key from cell B2 on the Admin worksheet and put it into a file named app.key which is saved in the same location as the workbook when the App is run for the first time. The key is then removed from cell B2 and replaced with the text “app key has been saved; you can keep running the App”. As long as the app.key file and the workbook are kept together in the same location, the App will keep working.
Like the previous code on getting the local file path of the workbook, this code can be left as is for other Apps. Only if the location of where the App Key needs to be entered before the first run is different from cell B2 on the worksheet named Admin, the keysheetName and keyCell variables (indicated with 1 and 2 in the screenshot above) need to be updated accordingly.
This App has a greenfield.job file associated with it that contains the Python script which will be run on the Optilogic platform when the App is run. The next piece of code checks that this greenfield.job file is saved in the same location as the Excel App, and it also sets the name of the folder to be created on the Optilogic platform where files will get uploaded to:
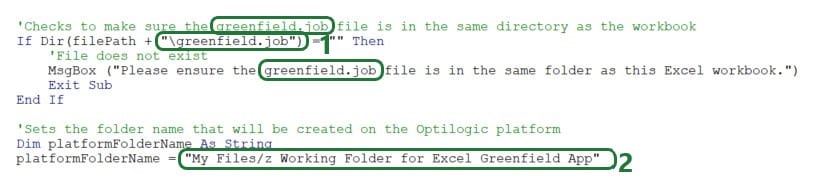
This code can be left as is for other Cosmic Frog for Excel Apps, except following will likely need updating:
The Greenfield settings are set in the next step. The ones the user can set on the Settings worksheet are taken from there and others are set to a default value:
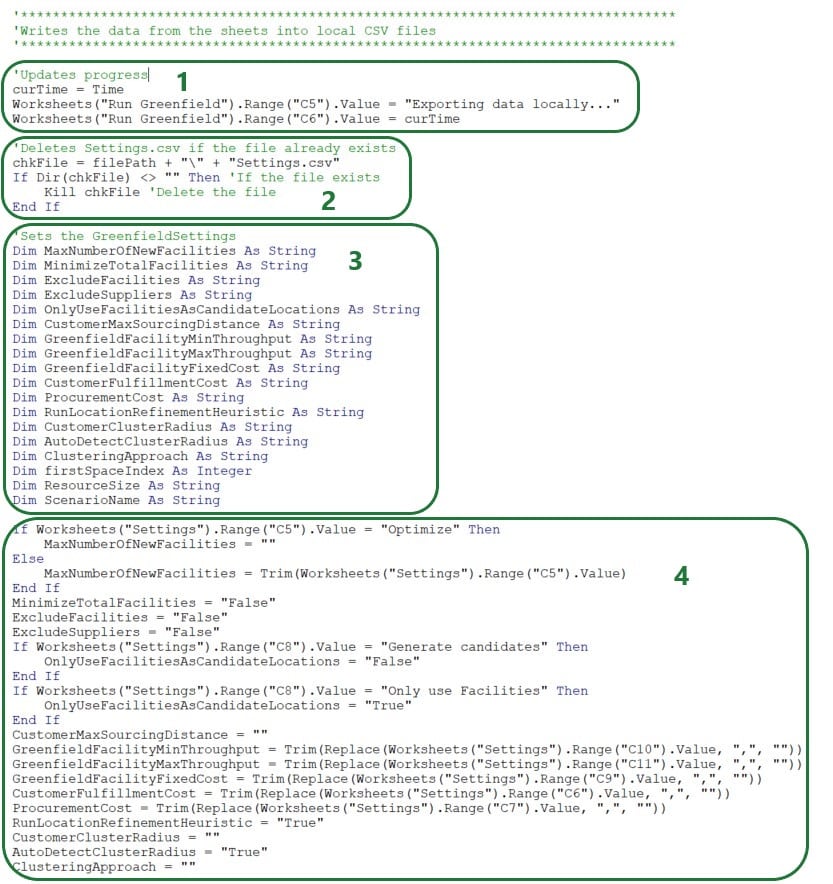
Next, the Greenfield Settings and the other input data are written into .csv files:
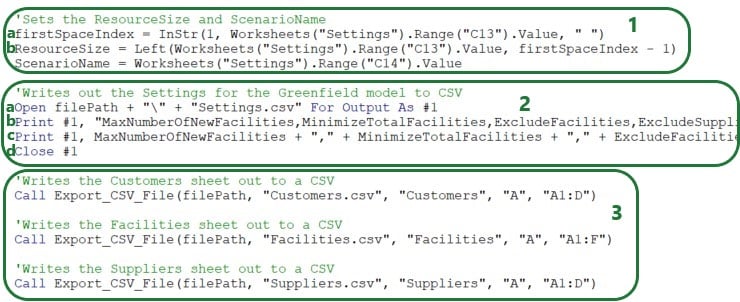
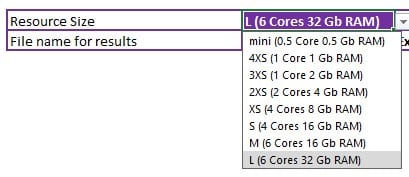
The firstSpaceIndex variable is set to the location of the first space in the resource size string.
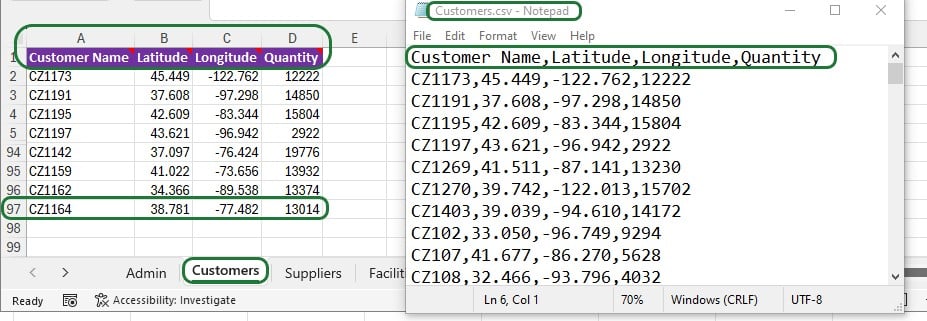
Looking in the Greenfield App on the Customers worksheet we see that this means that the Customer Name (column A), Latitude (column B), Longitude (column C), and Quantity (column D) columns will be exported. The Customers.csv file will contain the column names on the first row, plus 96 rows with data as the last populated row is row 97. Here follows a screenshot showing the Customers worksheet in the Excel App (rows 6-93 hidden) and the first 11 lines in the Customers.csv file that was exported while running the Greenfield App:
Other Cosmic Frog for Excel Applications will often contain data to be exported and uploaded to the Optilogic platform to refresh model data; the Export_CSV_File function can be used in the same way to export similar and other tabular data.
As mentioned in the “Python Job File and requirements.txt” section earlier, a requirements.txt file placed in the same folder as the .job file that contains the Python script is needed so the Python script can run using functionality from the cosmicfrog Python library. The next code snippet checks if this file already exists in the same location as the Excel App, and if not creates it there, plus writes the text cosmicfrog into it.

This code can be used as is by other Excel Apps.
The next step is to upload all the files needed to the Optilogic platform:
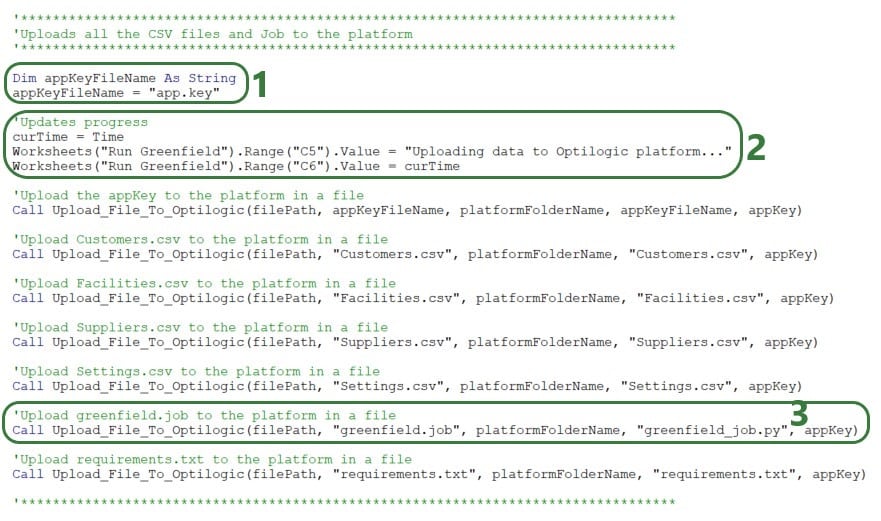
Besides updating the local/platform file names and paths as appropriate, the Upload_File_To_Optilogic Sub procedure will be used by most if not all Excel Apps: even if the App is only looking at outputs from model runs and not modifying any input data or settings, the function is still required to upload the .job, app.key, and requirements.txt files.
The next bit of code uses 2 more of the Optilogic.bas VBA module functions to run and monitor the Python job on the Optilogic platform:
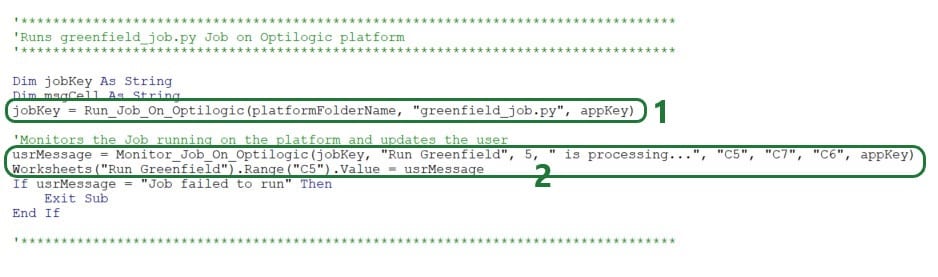
This piece of code can stay as is for most Apps, just make sure to update the following if needed:
The last piece of code before some error handling downloads the results (2 .csv files) from the Optilogic platform using the Download_File_From_Optilogic function from the Optilogic.bas VBA module:

This piece of code can be used as is with the appropriate updates for worksheet names, cell references, file names, path names, and text of status updates and user messages. Depending on the number of files to be downloaded, the part of the code setting the names of the output files and doing the actual download (bullet 2 above) can be copy-pasted and updated as needed.
The last piece of VBA code of the Macro shown in the screenshot below has some error handling. Specifically, when the Macro tries to retrieve the local path of the Macro-enabled .xlsm workbook and it finds it looks like it is online, an error will pop up and the user will be requested to put the file path name in cell B3 on the Admin worksheet. If the Macro hits any other errors, a message saying “An unexpected error occurred: <error number> <error description>” will pop up. This piece of code can be left as is for other Cosmic Frog for Excel Applications.

We have used version 3 of the Greenfield App which is part of the Building a Cosmic Frog for Excel Application resource in the above. There is also a stand-alone newer version (v6) of the Cosmic Frog for Excel – Greenfield application available in the Resource Library. In addition to all of the above, this App also:
This functionality is likely helpful for a lot of other Cosmic Frog for Excel Apps and will be discussed in section “Additional Common App Functionality” further below. We especially recommend using the functionality to prevent Excel from locking up in all your Apps.
Now we will go through the greenfield.job file that contains the Python script to be run on the Optilogic platform in detail.

This first piece of code takes care of importing several python libraries and modules (optilogic, pandas, time; lines 1, 2, and 5). There is another library, cosmicfrog, that is imported through the requirements.txt file that has been discussed before in the section titled “Python Job File and requirements.txt”. Modules from these libraries are imported here as well (FrogModel from cosmicfrog on line 3 and pioneer.API from optilogic on line 4). Now the functionality of these libraries and their modules can be used throughout the code of the script that follows. The optilogic and cosmicfrog libraries are developed by Optilogic and contain specific functionality to work with Cosmic Frog models (e.g. the functions discussed in the section titled “Working with Python Locally” above and on the Optilogic platform.
For reference:
This first piece of code can be left as is in the script files (.job files locally, .py files on the Optilogic platform) for most Cosmic Frog for Excel Applications. More advanced users may import different libraries and modules to use functionality beyond what the standard Python functionality plus the optilogic, cosmicfrog, pandas, and time libraries & modules together offer.
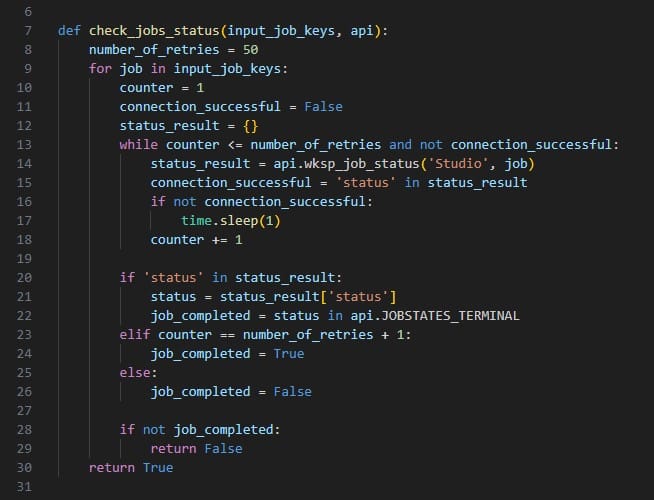
Next, a check_job_status function is defined that will keep checking a job until it is completed. This will be used when running a job to know if the job is done and ready to move onto the next step, which will often be downloading the results of the run. This piece of code can be kept as is for other Cosmic Frog for Excel Applications.
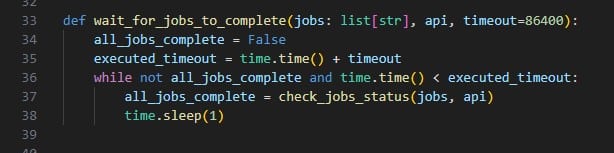
The following screenshot shows the next snippet of code that defines a function called wait_for_jobs_to_complete. It uses the check_job_status to periodically check if the job is done, and once done, moves onto the next piece of code. Again, this can be kept as is for other Apps.
Now it is time to create and/or connect to the Cosmic Frog model we want to use in our App:
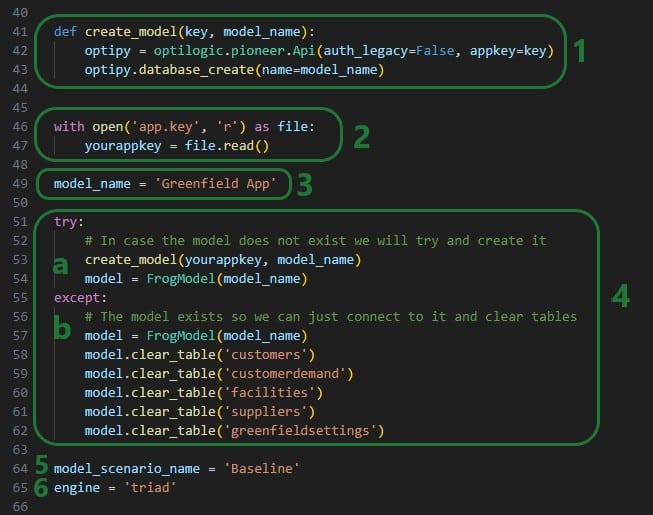
Note that like the VBA code in the Excel Macro, we can add comments describing what the code is doing to our Python script too. In Python, comments need to start with the number (/hash) sign # and the font of comments automatically becomes green in the editor that is being used here (Visual Studio Code using the default Dark Modern color theme).
After clearing the tables, we will now populate them with the date from the Excel workbook. First, the uploaded Customers.csv file that contain the columns Customer Name, Latitude, Longitude, and Quantity is used to update both the Customers and the CustomerDemand tables:

It is very dependent on the App that you are building how much of the above code you can use as is, but the concepts of reading csv files, renaming, and dropping columns as needed and writing tables into the Cosmic Frog model will be frequently used. The following piece of code also writes the Facilities and Suppliers data into the Cosmic Frog tables. Again, the concepts used here will be useful for other Apps too, it may just not be exactly the same depending on the App and the tables that are being written to:
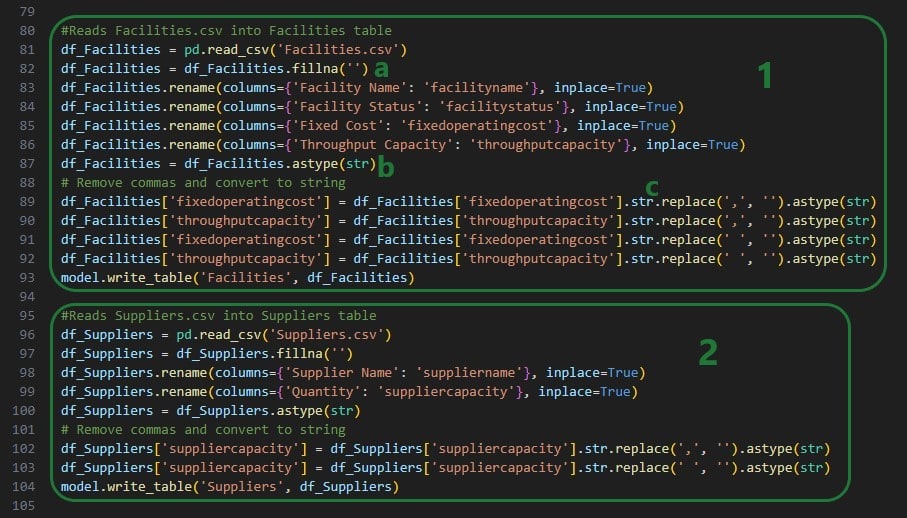
Next up, the Settings.csv file is used to populate the Greenfield Settings table in Cosmic Frog and to set 2 variables for resource size and scenario name:

Now that the Greenfield App Cosmic Frog model is populated with all the data needed, it is time to kick off the model and run a Greenfield analysis:
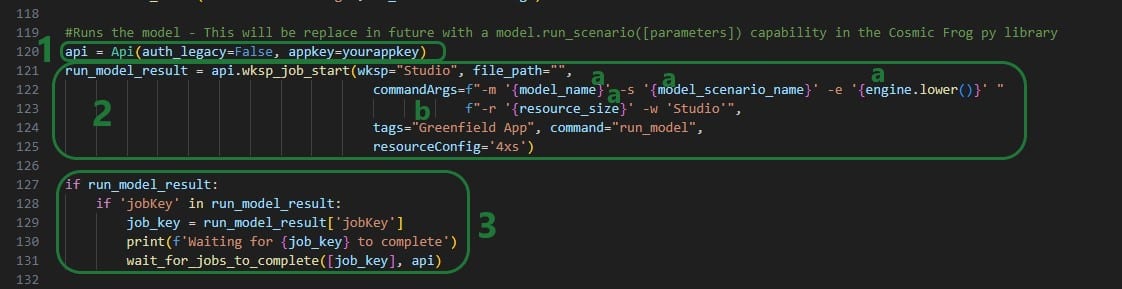
Besides updating any tags as desired (bullet 2b above), this code can be kept exactly as is for other Excel Apps.
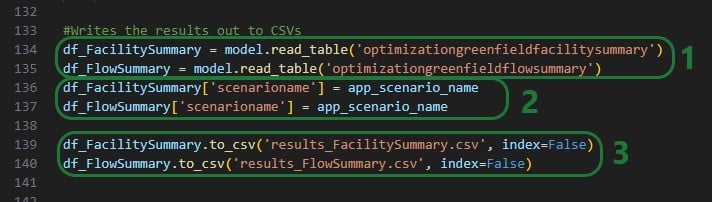
Lastly, once the model is done running, the results are retrieved from the model and written into .csv files, which will then be downloaded by the Excel Macro:
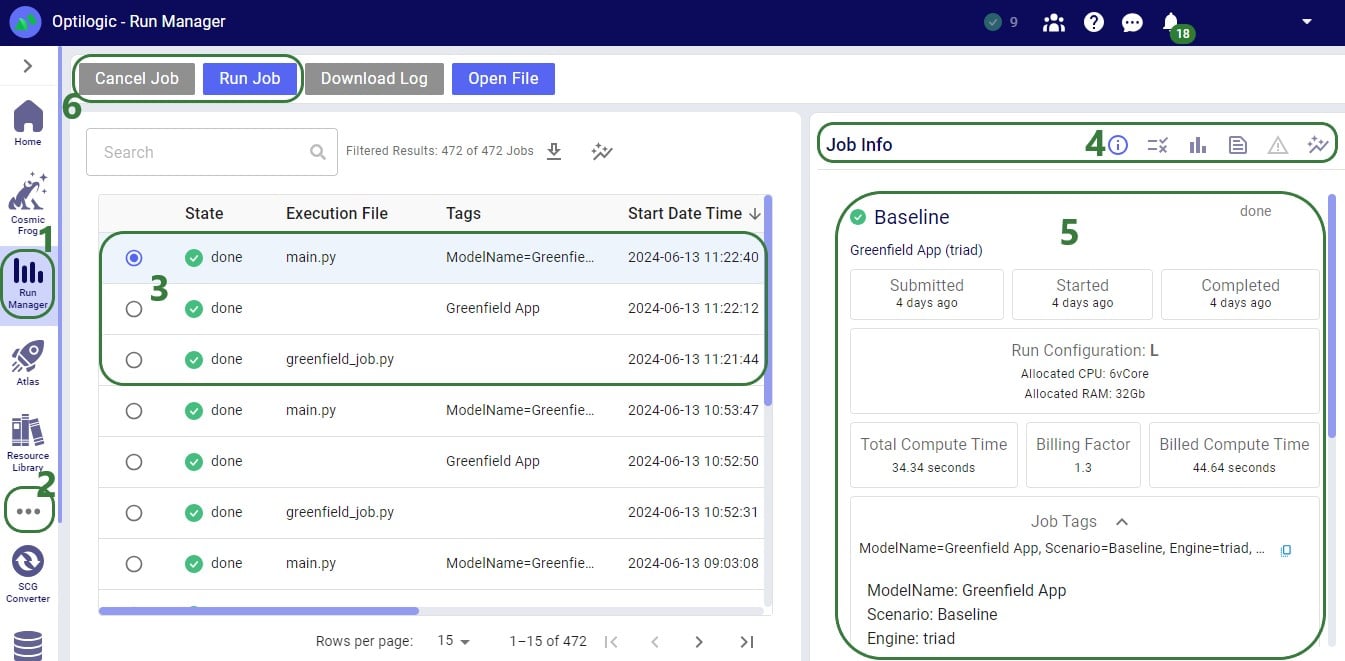
When the greenfield_job.py file starts running on the Optilogic platform, we can monitor and see the progress of the job in the Run Manager App:
The Greenfield App (version 3) that is part of the Building a Cosmic Frog for Excel Application resource covers a lot of common features users will want to use in their own Apps. In this section we will discuss some additional functionality users may also wish to add to their own Apps. This includes:
A newer version of the Greenfield App (version 6) can be found here in the Resource Library. This App has all the functionality version 3 has, plus: 1) it has an updated look with some worksheets renamed and some items moved around, 2) has the option to cancel a Run after it has been kicked off and has not completed yet, 3) it prevents locking up of Excel while the App is running, 4) reads a few CSV output files back into worksheets in the same workbook, and 5) uses a Python library called folium to create Maps that a user can open from the Excel workbook, which will then open the map in the user’s default browser. Please download this newer Greenfield App if you want to follow along with the screenshots in this section. First, we will cover how a user can prevent locking of Excel during a run and how to add a cancel button which can stop a run that has not yet completed.
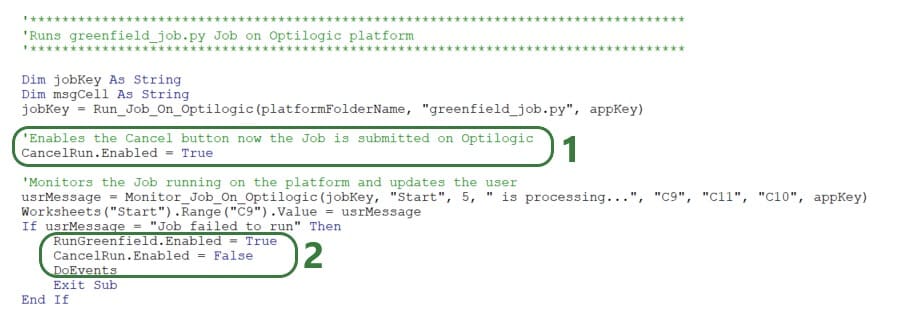
The screenshots call out what is different as compared to version 3 of the App discussed above. VBA code that is the same is not covered here. The first screenshot is of the beginning of the RunGreenfield_Click Macro that runs when the user hits the Run Greenfield button in the App:

The next screenshot shows the addition of code to enable the Cancel button once the Job has been uploaded to the Optilogic platform:
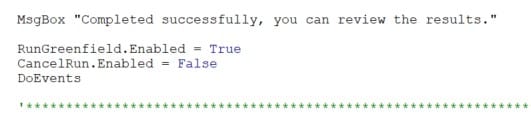
If everything completes successfully, a user message pops up, and the same 3 lines of code are added here too to enable the Run Greenfield buttons, disable the Cancel button, and keep other applications accessible:
Finally, a new Sub procedure CancelRun is added that is assigned to the Cancel button and will be executed when the Cancel button is clicked on:
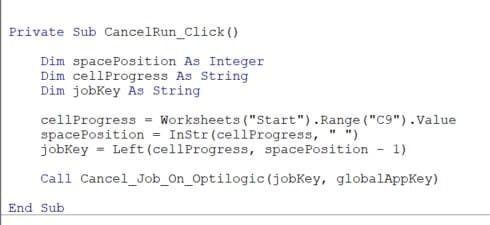
This code gets the Job Key (unique identifier of the Job) from cell C9 on the Start worksheet and then uses a new function added to the Optilogic.bas VBA module that is named Cancel_Job_On_Optilogic. This function takes 2 arguments: the Job Key to identify the run that needs to be cancelled and the App Key to authenticate the user on the Optilogic platform.
Version 6 of the Greenfield App reads results from the Facility Summary, Customer Summary, and Flow Summary back into 3 worksheets in the workbook. A new Sub procedure named ImportCSVDataToExistingSheet (which can be found at the bottom of the RunGreenfield Macro code) is used to do this:

The function is used 3 times: to import 1 csv file into 1 worksheet at a time. The function takes 3 arguments:
We will discuss a few possible options on how to visualize your supply chain and model outputs on maps when using/building Cosmic Frog for Excel Applications.
This table summarizes 3 of the mapping options: their pros, cons, and example use cases:

There is standard functionality in Excel to create 3D Maps. You can find this on the Insert tab, in the Tours groups (next to Charts):
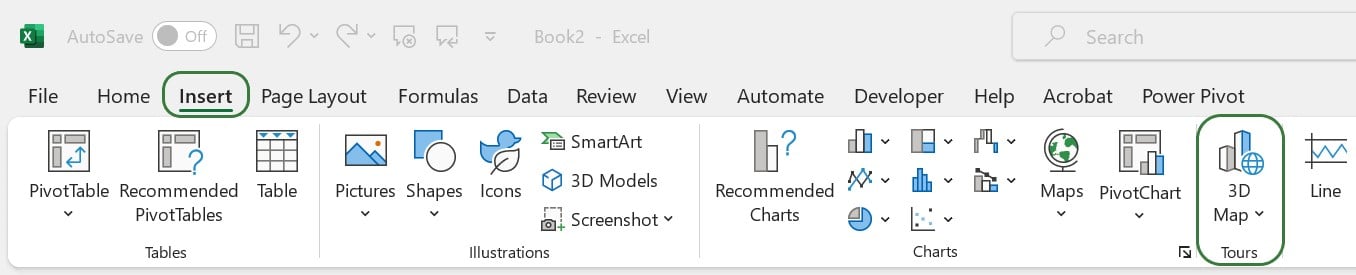
Documentation on how to get started with 3D Maps in Excel can be found here. Should your 3D Maps icon be greyed out in your Excel workbook, then this thread on the Microsoft Community forum may help troubleshoot this.
How to create an Excel 3D Map in a nutshell:
With Excel 3D Maps you can visualize locations on the map and for example base their size on characteristics like demand quantity. You can also create heat maps and show how location data changes over time. Flow maps that show lines between source and destination locations cannot be created with Excel 3D Maps. Refer to the Microsoft documentation to get a deeper understanding of what is possible with Excel 3D Maps.
The Cosmic Frog for Excel – Geocoding App in the Resource Library uses Excel 3D Maps to visualize customer locations that the App has geocoded on a map:
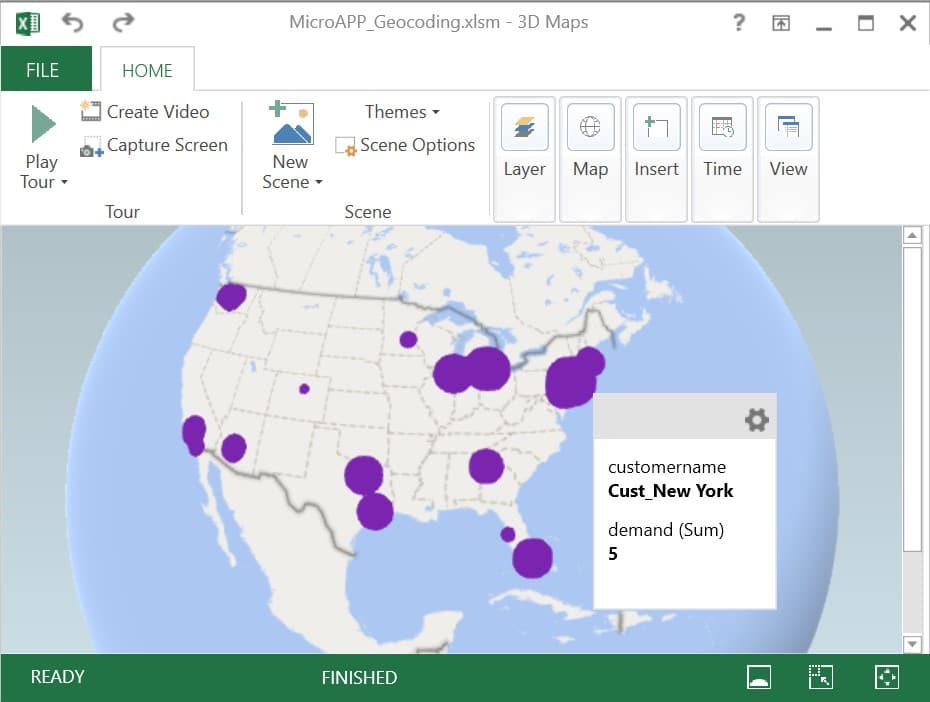
Here, the geocoded customers are shown as purple circles which are sized based on their total demand.
A good option to for example visualize Hopper (= transportation optimization) routes on a map is the ArcGIS Excel Add-in. If you do not have the add-in, you can get it from within Excel as follows:
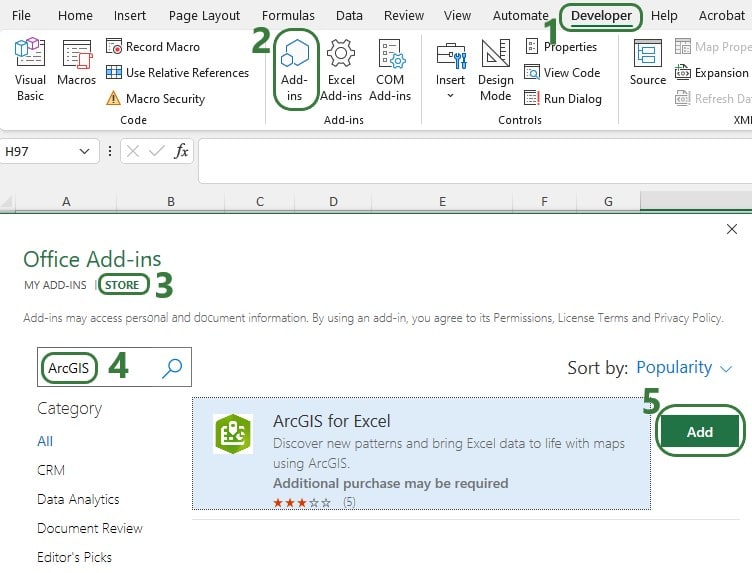
You may be asked to log into your Microsoft account when adding this in and/or when starting to use the Add-in. Should you experience any issues while trying to get the Add-in added to Excel, we recommend closing all Office applications and then only open one Excel workbook through which you add the Add-in.
To start using the add-in and create ArcGIS maps in Excel:
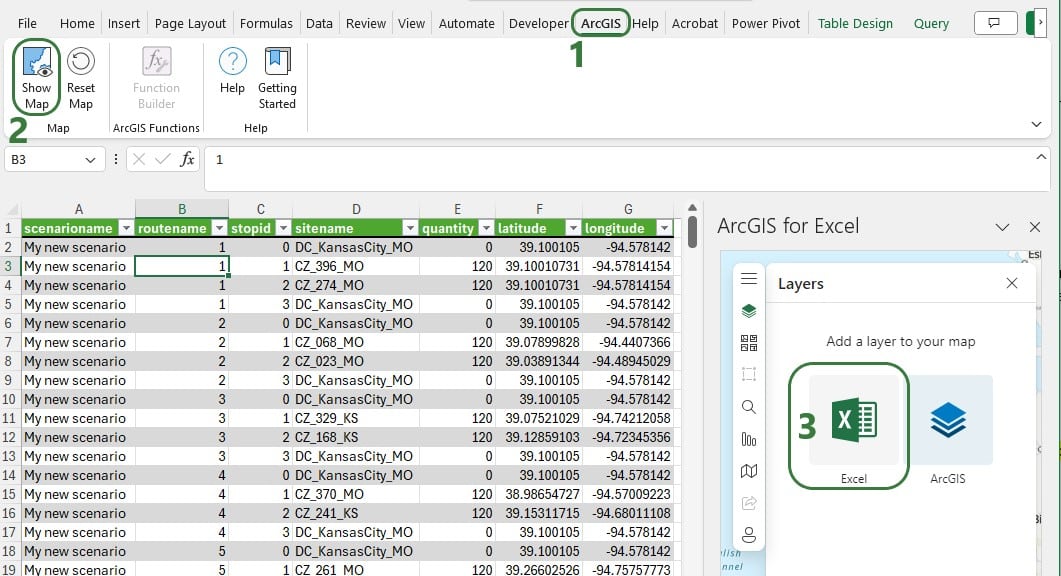
Excel will automatically select all data in the worksheet that you are on. You can ensure the mapping of the data is correct or otherwise edit it:

After adding a layer, you can further configure it through the other icons at the top of the Layers window:
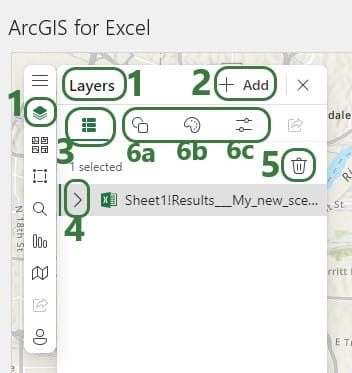
The other configuration options for the Map are found on the left-hand side of the Map configuration pane:
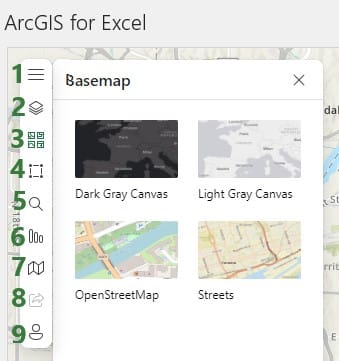
As an example, consider the following map showing the stops on routes created by the Hopper engine (Cosmic Frog’s transportation optimization technology). The data in this worksheet is from the Transportation Stop Summary Hopper output table:
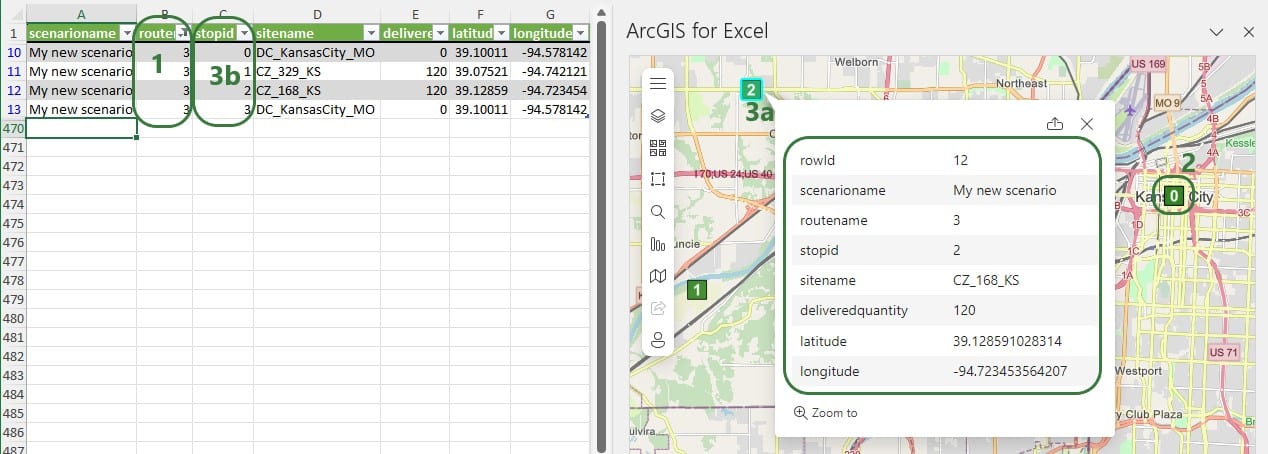
As a next step we can add another layer to the map based on the Transportation Segment Summary Hopper output table to connect the source-destination pairs with each other using flow lines. For this we need to use the Esri JSON Geometry Location types mentioned earlier. An example Excel file containing the format needed for drawing polylines can be found in the last answer of this thread on the Esri community website: https://community.esri.com/t5/arcgis-for-office-questions/json-formatting-in-arcgis-for-excel/td-p/1130208, on the PolylinesExample1 worksheet. From this Excel file we can see that the format needed to draw a line connecting 2 locations:
{“paths”: [[<point1_longitude>,<point1latitude>],[<point2_longitude>,<point2_latitude>]],”spatialReference”: {“wkid”: 4326}}
Where wkid indicates the well-known ID of the spatial reference to be used on the map (see above for a brief explanation and a link to a more elaborate explanation of spatial references). Here it is set to 4326, which is WGS 1984.
The next 2 screenshots show the data from a Segments Summary and an added layer to the map to show the lines from the stops on the route:
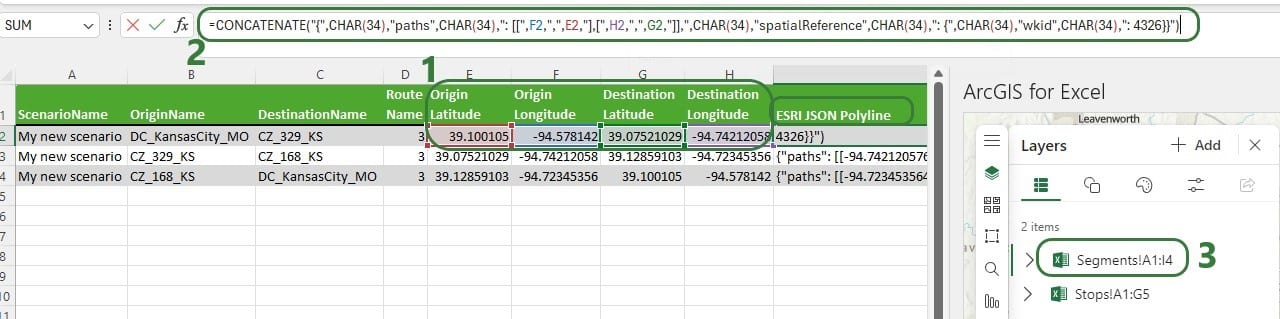

Note that for Hopper outputs with multiple routes, we now need to filter both the worksheet with the Stops information and the worksheet with the Segments information for the same route(s) to synchronize them. A better solution is to bring the stopID and Delivered Quantity information from the Stops output into the Segments output, so we only have 1 worksheet with all the information needed and both layers are generated from the same data. Then filtering this set of data will update both layers simultaneously.
Here, we will discuss a Python library called folium, which gives users the ability to create maps that can show flows, tooltips, and has options to customize/auto-size location shapes and flow lines. We will use the example of the Cosmic Frog for Excel – Greenfield App (version 6) again where maps are created as .html files as part of the greenfield_job.py Python script that runs on the Optilogic platform. They are then downloaded as part of the results and from within Excel, users can click on buttons to show flows or customers which then opens the .html files in user’s default browser. We will focus on the differences with version 3 of the Greenfield App that are related to maps and folium. We will discuss the changes/addition to both the VBA code in the Excel Run Greenfield Macro and the additions to greenfield_job.py. First up in the VBA code, we need to add folium to the requirements.txt file so that the Python script can make use of the library once it is uploaded to the Optilogic platform:
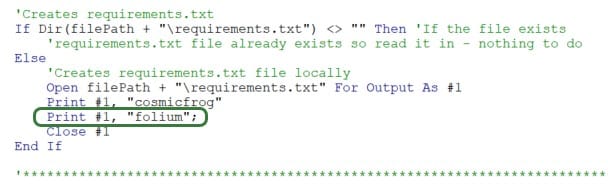
To do so, a line to the VBA code is added to write “folium” into requirements.txt.
As part of downloading all the results from the Optilogic platform after the Greenfield run has completed, we need to add downloading the .html map files that were created:

In this version of the Greenfield app, there is a new Results Summary worksheet that has 3 buttons at the top:

Each of these buttons has a Sub procedure assigned to it, let’s look at the one for the “Show Flows with Customers” button:
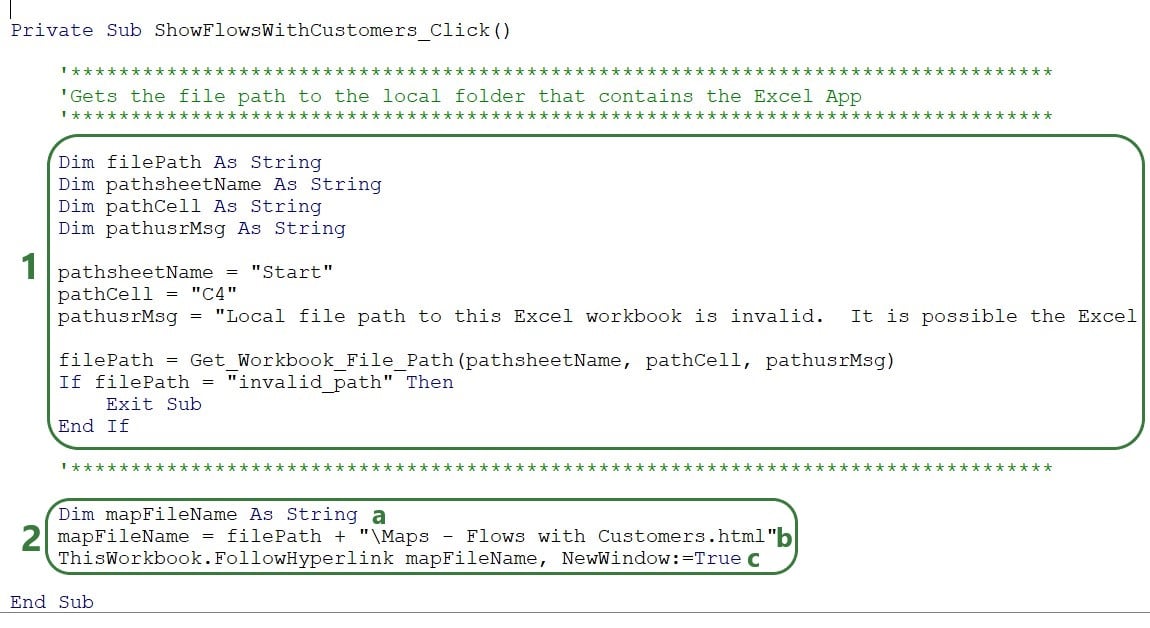
The map that is opened will look something like this, where a tooltip comes up when hovering over a flow line. (How to create and configure the map using folium will be discussed next.)
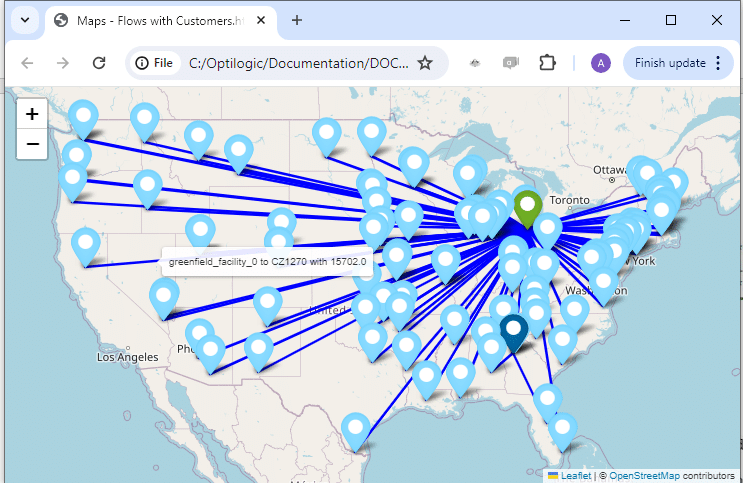
The additions to the greenfield.job file to make use of folium and creating the 3 maps will now be covered:
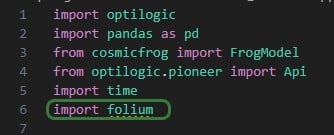
First, at the beginning of the script, we need to add “import folium” (line 6), so that the library’s functionality can be used throughout the script. Next, the 3 Greenfield output tables that are used to create the 3 maps are read in, and a few data type changes are made to get the data ready for mapping:
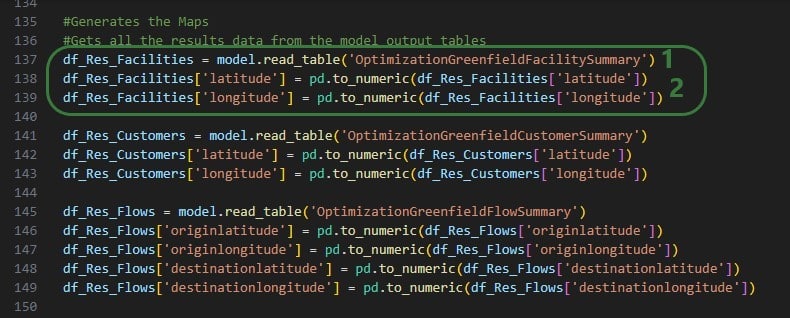
This is repeated twice, once for the Optimization Greenfield Customer Summary output table and once for the Optimization Greenfield Flow Summary output table.
The next screenshot shows the code where the map to show Facilities is created and the Markers of them are configured based on if the facility is an Existing Facility or a Greenfield Facility:
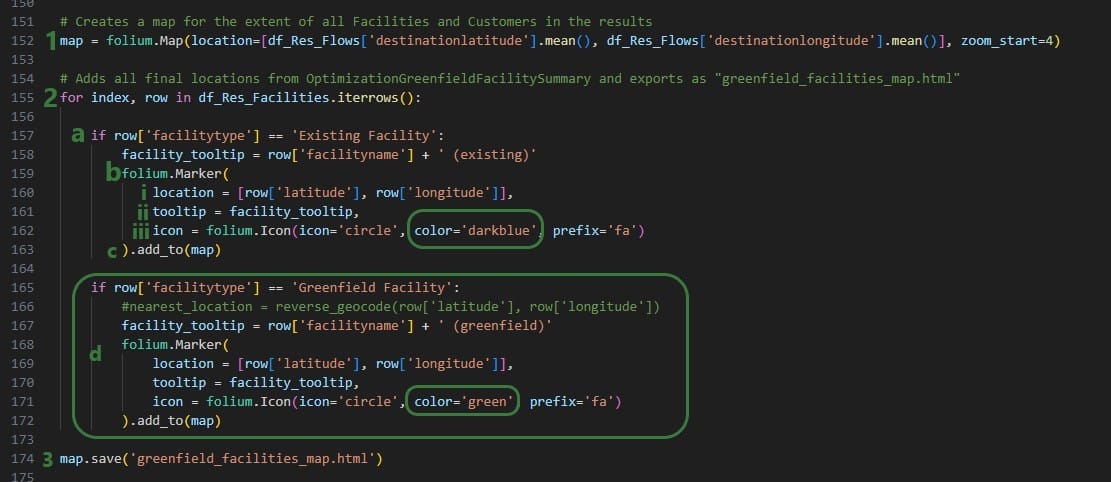
In the next bit of code, df_Res_Flows dataframe is used to draw lines on the map between origin and destination locations:
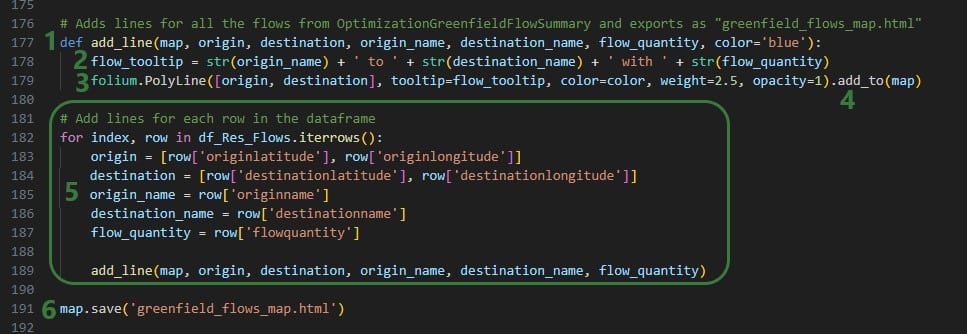
Lastly, the customers from the Optimization Greenfield Customer Summary output table are added to the map that already contains facilities and flow lines, and is saved as greenfield_flows_customers_map.html:

Here are some additional pointers that may be useful when building your own Cosmic Frog for Excel applications:
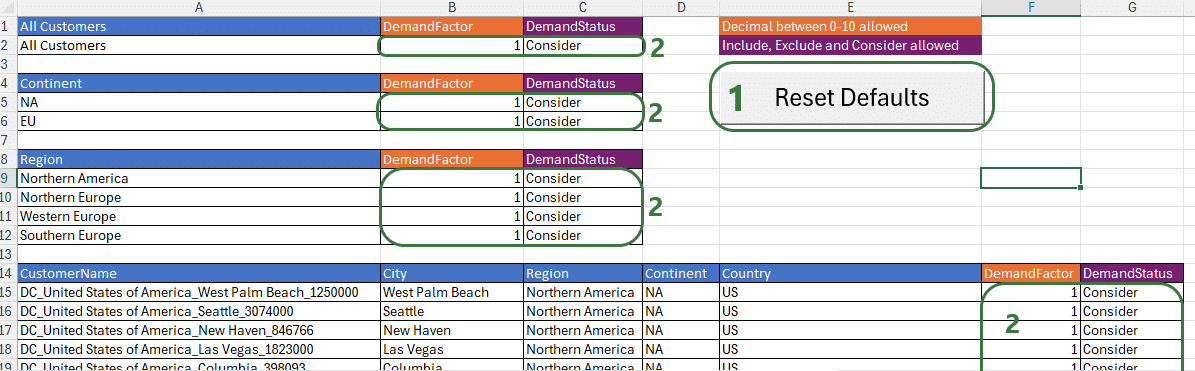

You may run into issues where Macros or scripts are not running as expected. Here we cover some common problems you may come across and their solutions.
When opening an Excel .xslm file you may find that you see following message about the view being protected, you can click on Enable Editing if you trust the source:

Enabling content is not necessarily sufficient to also be able to run any Macros contained in the .xlsm file, and you may see following message after clicking on the Enable Editing button:
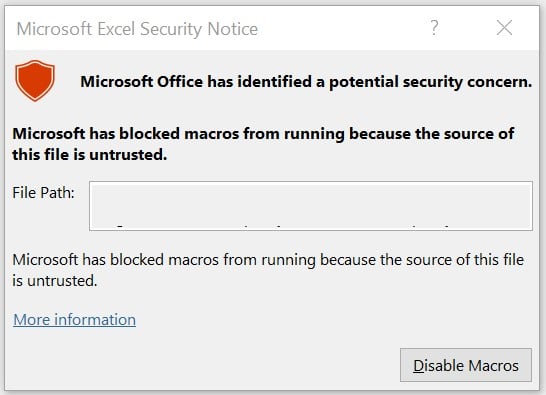
Closing this message box and then trying to run a Macro will result in the following message.

To resolve this, it is not always sufficient to just close and reopen the workbook and enable macros as the message suggests. Rather, go to the folder where the .xlsm file is saved in File Explorer, right click on it, and select Properties:

At the bottom in the General tab, check the Unblock checkbox and then click on OK.
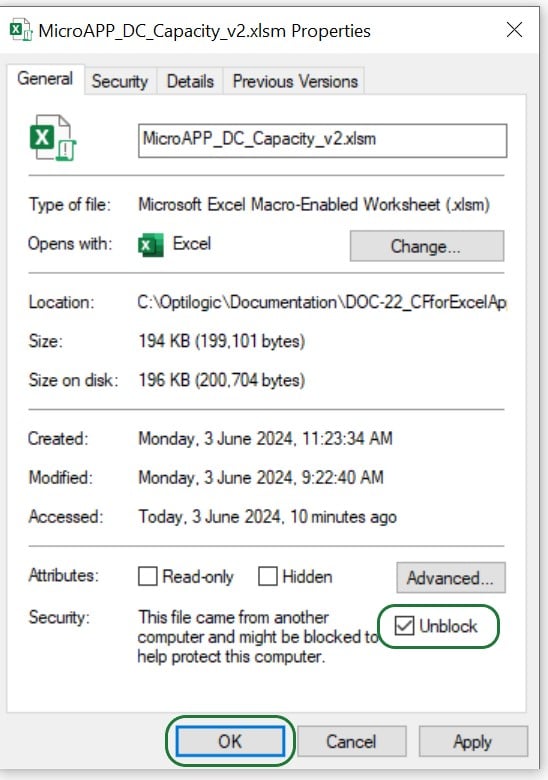
Now, when you open the .xlsm file again, you have the option to Enable Macros, do so by clicking on the button. From now on, you will not need to repeat any of these steps when closing and reopening the .xlsm file; Macros will work fine.
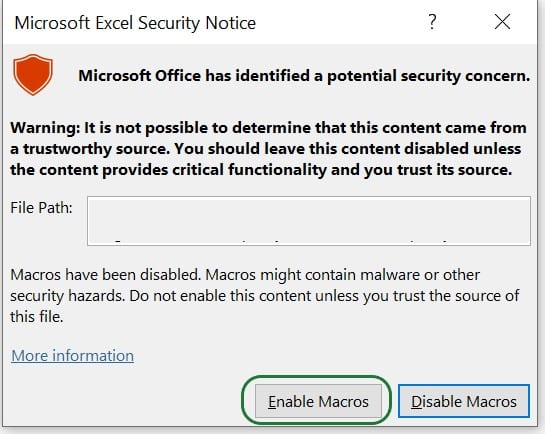
It is also possible that instead of the Enable Editing warning and warnings around Macros not running discussed above, you will see a message that Macros have been disabled, as in the following screenshot. In this case, please click on the Enable Content button:

Depending on your anti-virus software and its settings, it is possible that the Macros in your Cosmic Frog for Excel Apps will not run as they are blocked by the anti-virus software. If you get “An unexpected error occurred: 13 Type mismatch”, this may be indicative of the anti-virus software blocking the Macro. Work with your IT department to allow the running of Macros.
If you are running Python scripts locally (say from Visual Studio Code) that are connecting to Cosmic Frog models and/or uploading files to the Optilogic platform, you may be unsuccessful and get warnings with the text “WARNING – create_engine_with_retry: Database not ready, retrying”. In this case, the likely cause is that your IP address needs to be added to the list of firewall exceptions within the Optilogic platform, see the instructions on how to do this in the “Working with Python Locally” section further above.
You will find that if you export cells that contain formulas from Excel to CSV that these are exported as 0’s and not as the calculated value. Possible solutions for this are 1) to export to a format other than CSV, possibly .xslx, or 2) to create an extra column in your data where the results of the cells with formulas are copy-pasted as values into and export this column instead of the one with the formulas (this way the formulas stay intact for a next run of the App). You could use the record Macro option to get a start on the VBA code for copy-pasting values from a certain column into a certain column so that you do not have to manually do this each time you run the App, but it becomes part of the Macro that runs when the App runs. An example of VBA code that copy-pastes values can be seen in this screenshot:
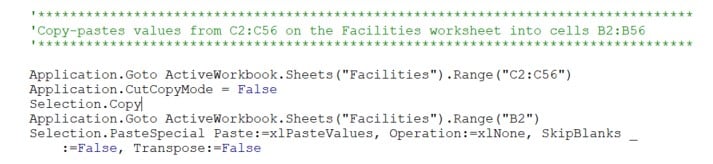
When running an App that has been run previously, there are likely output files in the folder where the App is located, for example CSV files that are opened by the user to view the results or are read back into a worksheet in the App. When running the App again, it is important to not have these output files open, otherwise an error will be thrown when the App gets to the stage of downloading the output files since open files cannot be overwritten.
There are currently several Cosmic Frog for Excel Applications available in the Resource Library, with more being added over time. Check back frequently and search for “Cosmic Frog for Excel” in the search bar to find all available Apps. A short description for each App that is available follows here:
As this documentation contains many links to references and resources, we will list them all here in one place:
We love for our users to connect, keep up to date, learn from and share with other Cosmic Frog users & experts through the Frogger Pond Community! If you have an Optilogic account (see this page on how to create your free account if you do not have one yet), you can use that same account to log into the Frogger Pond Community.
Here, we will describe what the Frogger Pond Community consists of, how to interact with, search, sort, and contribute to Topics, and how to manage your account. Recommended reads for new users are included in the last section too.
When you login to the Frogger Pond Community, the homepage you see will look similar to the screenshot below:
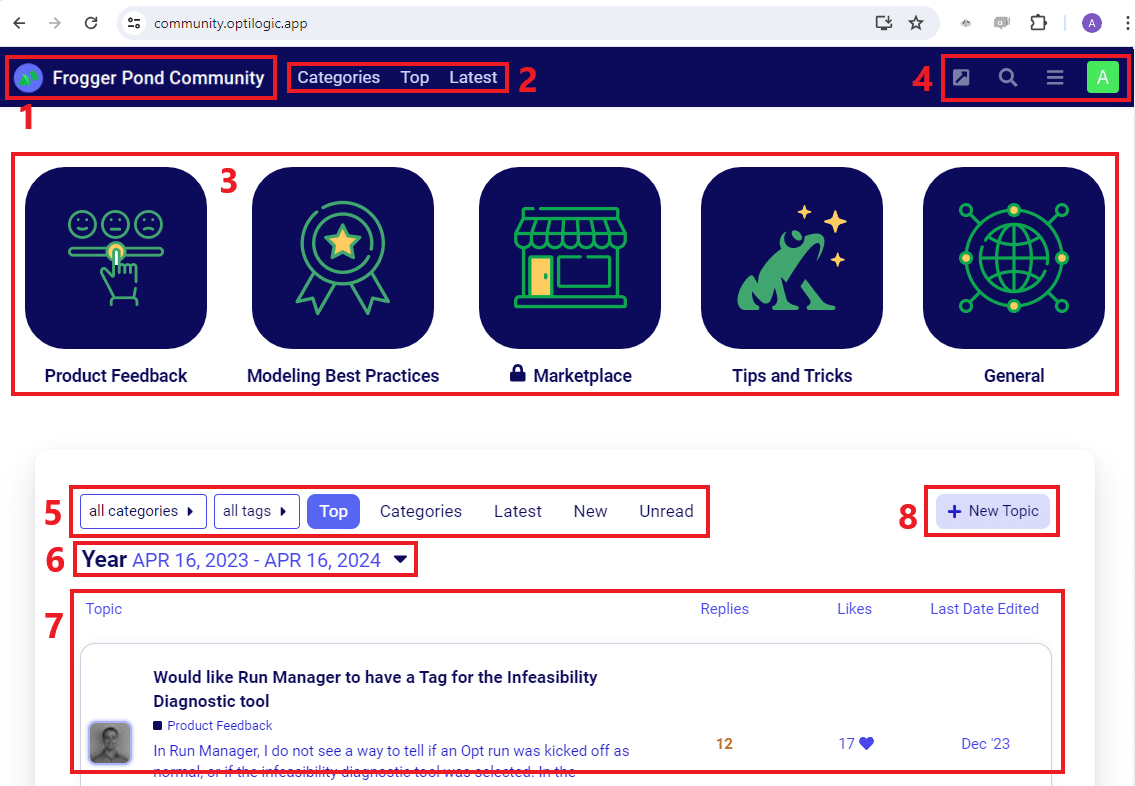
Once you have clicked on a topic that you want to read and possibly interact with, you will see something similar to the following screenshot:
After you click on the “+ New Topic” button, the following window will pop-up at the bottom of your browser:
The third icon at the top right of the homepage opens a Menu that you can use to quickly navigate to different parts of the Frogger Pond Community.
When you click on your profile picture at the top right of the homepage, a small window that gives you quick access to (from left to right) Notifications (bell icon), Bookmarks (bookmark icon), Messages (envelope icon), and Preferences (person icon) opens up:
If you click on the upside-down caret at the bottom of notifications, bookmarks, or messages or click on any item in the preferences list, you will be taken to that area of your account. In the following screenshot, we have gone to the Messages section of the user account:
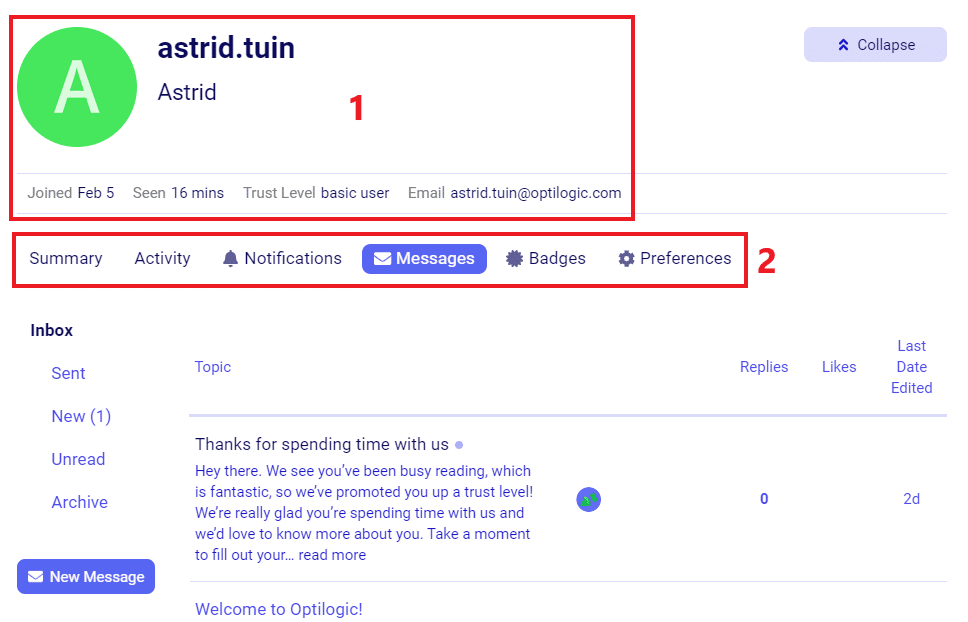
Using a platform you may not be familiar with can be overwhelming. To help new users getting started, we recommend reading the following items. These are also mentioned in the “Welcome to Optilogic!” message all new users of the Frogger Pond Community receive.
We look forward to your questions & contributions over at the Frogger Pond!
There are two methods for establishing a secure connection to the Optilogic platform:
An App key is a code that can be linked to your account and will not expire. API keys are generated with code and only last for one hour before they expire. Both keys can be useful depending on how you wish to access the platform. Without either an App Key or an API Key you will not be able to run any API endpoints.
Login to the Optilogic website and click on your name in the top right corner, then click on “Account.”
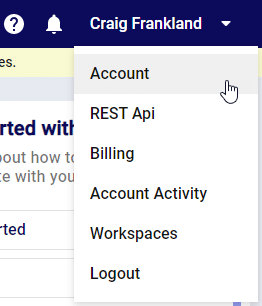
Click on the “App Key Management” tab from their name your app key and click on the “Create Key” button.
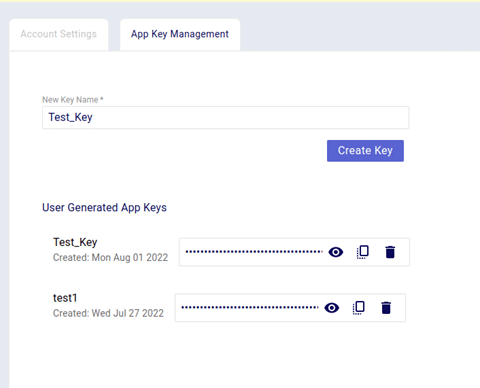
At this point you may copy your App Key to be used for authentication purposes.
To generate an API key you will need to leverage python and the following instructions.
In a python file copy and paste this code and replace the USERNAME and PASSWORD with your own. Make sure to remove both sets of {{}} curly brackets so that it looks like this: headers = {‘X-USER-ID’: ‘CMorrell’ }
import requests
url = ‘https://api.optilogic.app/v0/r…’
headers = {
‘X-USER-ID’: ‘{{user_id}}’,
‘X-USER-PASSWORD’: ‘{{user_password}}’
}
response = requests.request(‘POST’, url, headers=headers)
print(response.text)
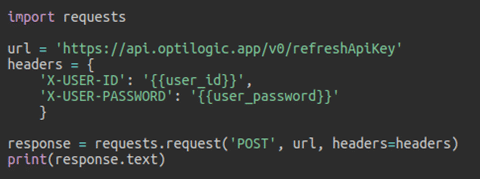
The result of this code will be an API key that can be used for authentication.
When running geocoding through the default Mapbox provider, all of the available location data from the Customers, Facilities and Suppliers table will be used to try and determine the latitude and longitude coordinates. Mapbox will use all of these components and perform the best mapping possible and will return a latitude / longitude coordinate along with a confidence score. By default, Cosmic Frog will only accept scores with a confidence score of 100. You can optionally turn this option off and the top confidence score will then be returned by Mapbox.

More information on how Mapbox calculates latitude and longitude coordinates can be found here: Mapbox Geocoding Documentation.
If you’d like to use an alternate provider instead of Mapbox, setup instructions can be found here: Using Alternate Geocoding Providers.
Every account holder has access to create the Global Supply Chain Strategy demo model. Following is an overview of the features of the model (and of Cosmic Frog).
If you wish to build the model instead, please follow the instructions located here: Build Your First Cosmic Frog Model
When running Cosmic Frog models and other jobs on the Optilogic platform, cloud resources are used. Usage of these resources is billed based on the billing factor of the resource used for the job. Each Optilogic customer has an amount of cloud compute hours included in their Master License Agreement (MLA). Users may want to check how many of these hours have been used up and in this documentation 2 ways to do so will be covered. In the last section we will touch on how to best track hours at the team/company level.
The first option for hours tracking that will be covered is through the Usage tab in the user’s Account:
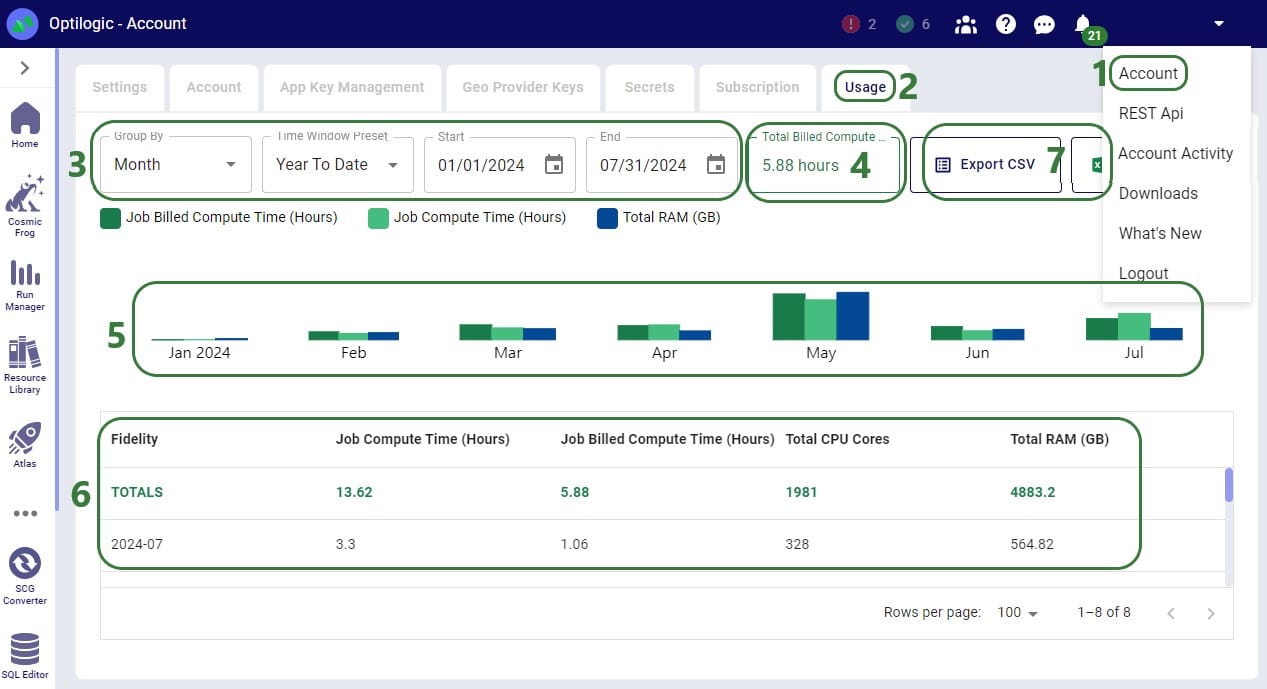
If a user is asked by their manager to report the hours they have used on the Optilogic platform, they can go here and use the Custom Time Window Preset option to align the start and end date of the reporting period with the dates of the MLA. They can then report back the number shown as the Total Billed Compute Time (box 4 in the above screenshot).
Through the Run Manager application on the Optilogic platform, user can also analyze their jobs run, including retrieving the Total Billed Compute Time:
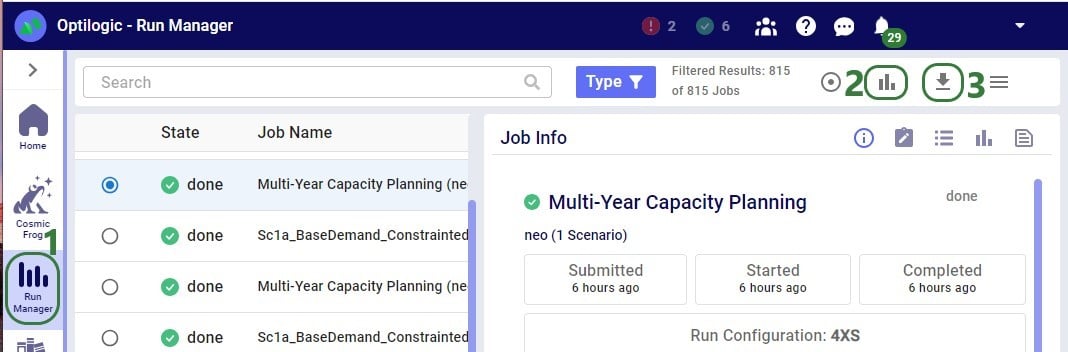
After clicking on the View Charts icon, a screen similar to the following screenshot will be shown:


If a user needs to report their hours used on the Optilogic platform, they can download this jobs.csv file and:
Currently, only tracking of usage hours at the individual user level is available as described above. To get total team or company usage, a manager can ask their users to use 1 of the above 2 methods to report their Total Billed Compute Time and the manager can then add these up to get the total used hours so far. Tracking at the team/company level is planned to be made available on the Optilogic platform later in 2024.
With Intelligent Greenfield Analysis (the Triad engine in Cosmic Frog), you have control over several different solve settings. For ease of use with scenario modeling, these have been placed in a dedicated table called Greenfield Settings. This allows for quick scenario building that leverages the column names. We will cover the settings which can be configured on the Greenfield Settings table and show an example of how scenarios can be used to change these settings.
Following screenshot shows the Greenfield Settings table:
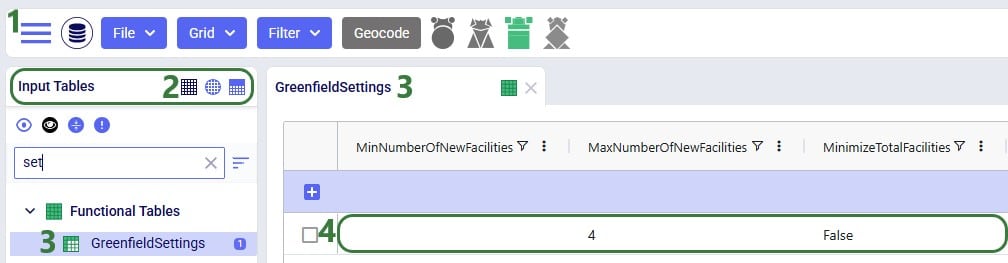
An explanation of each setting is as follows:
Note that the “Getting Started with Intelligent Greenfield Analysis” help article contains a visual explanation of customer clustering too.
Finally, we will look at an example where a scenario item changes a Greenfield setting:
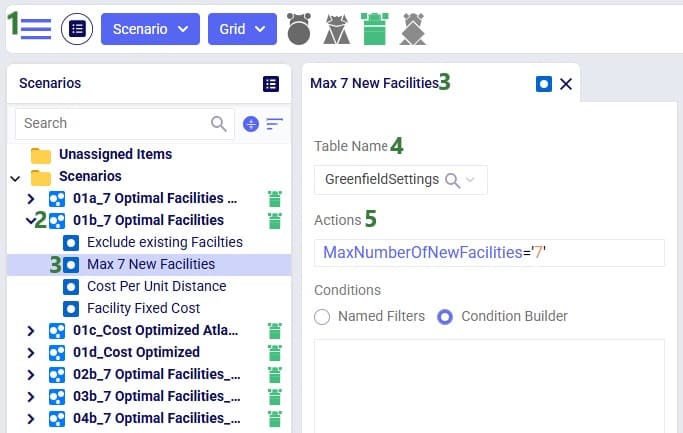
In this section, we outline some techniques for debugging models in Cosmic Frog. In general, there’s no one “right” approach to debugging, but knowing where you can get information on what went wrong can be helpful.
An error state in the run manager is the most obvious sign that something is wrong with our model setup.

After reaching an error state, the first place to check is the Job Records section of the Run Manager. Here you will find a summary of events from the model solve, and if an error is thrown you can potentially see the cause directly from here:
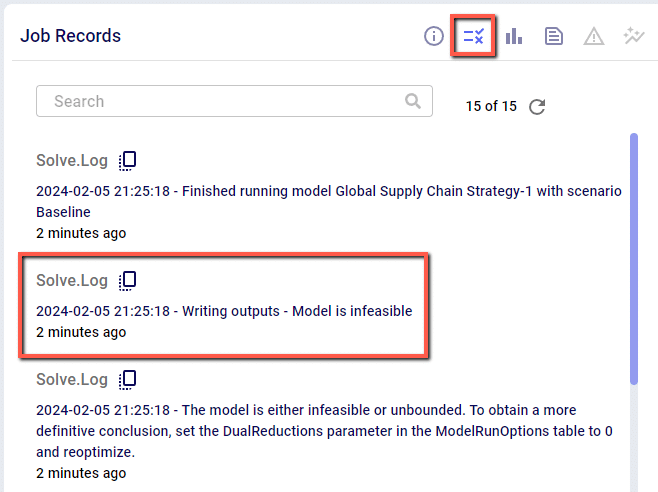
Next, you can check the Job Error Log. The Job Error Log will contain more detailed messaging on errors that are thrown during a model solve. While there are a number of possible errors, the most common cause of an error state is an infeasible model. You can check if your model is infeasible by scrolling down to the bottom of the Job Error Log, or by searching for “infeasible” in the search bar.
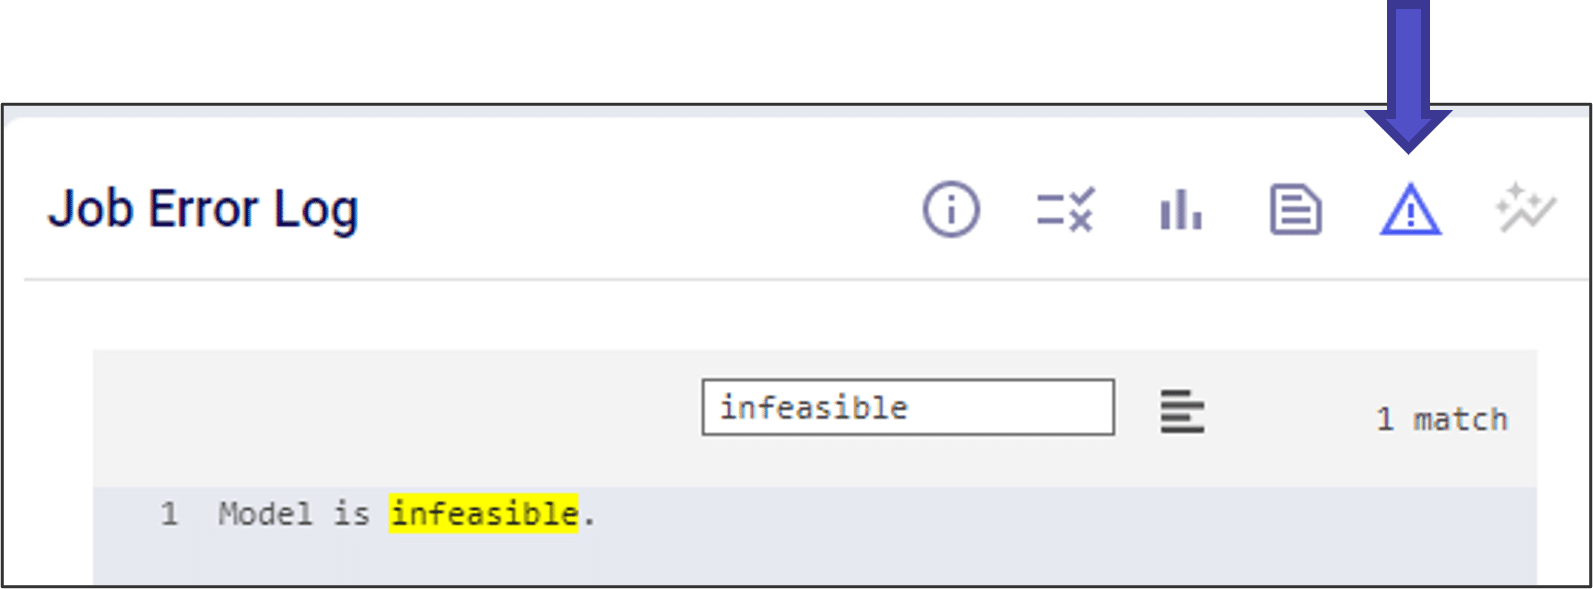
If your model is infeasible, you can use the following toolkit to help understand why:
Sometimes even a model that finishes running can give results that we do not expect. It a good habit to check your Output Summary Tables after each run to make sure the results look like you expect.

In some cases, the output tables might not populate even if the model runs successfully. Even if these values do not populate, you can find the Gurobi optimization results in the job log. One useful tip is to search for “objective value” in the job log and make sure the value is in the range you expect.
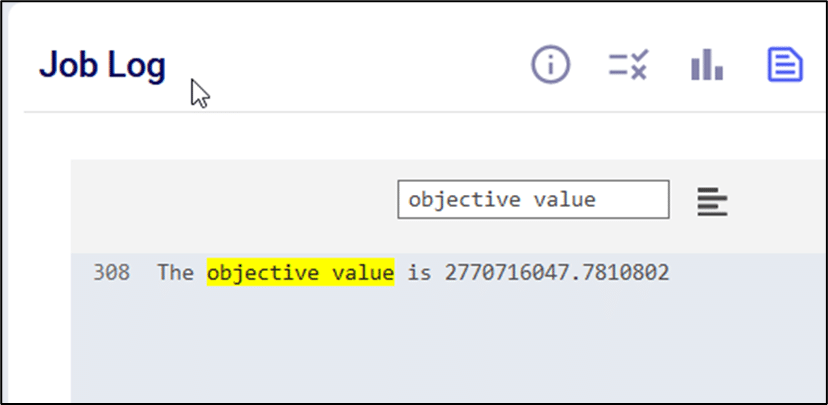
If your model is running, but seems incorrect, you can use the following toolkit to help understand why:
If you are still having trouble, you can also reach out to us directly at support@optilogic.com.
Watch the video for an introduction to the features and functions of the Optilogic Intelligent Greenfield (Triad) engine.
There are four main methods for adding data to Atlas:
1. Drag/Drop
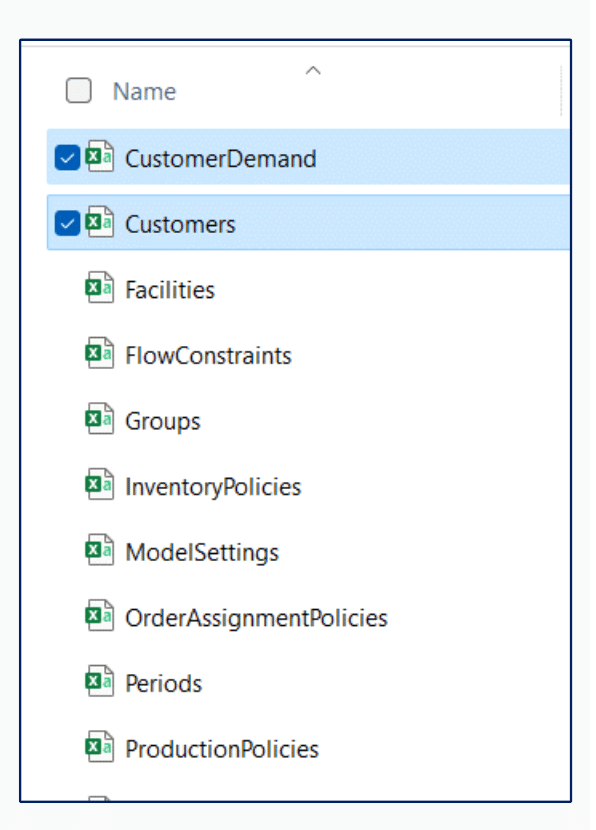
2. Upload tool

3. OneDrive
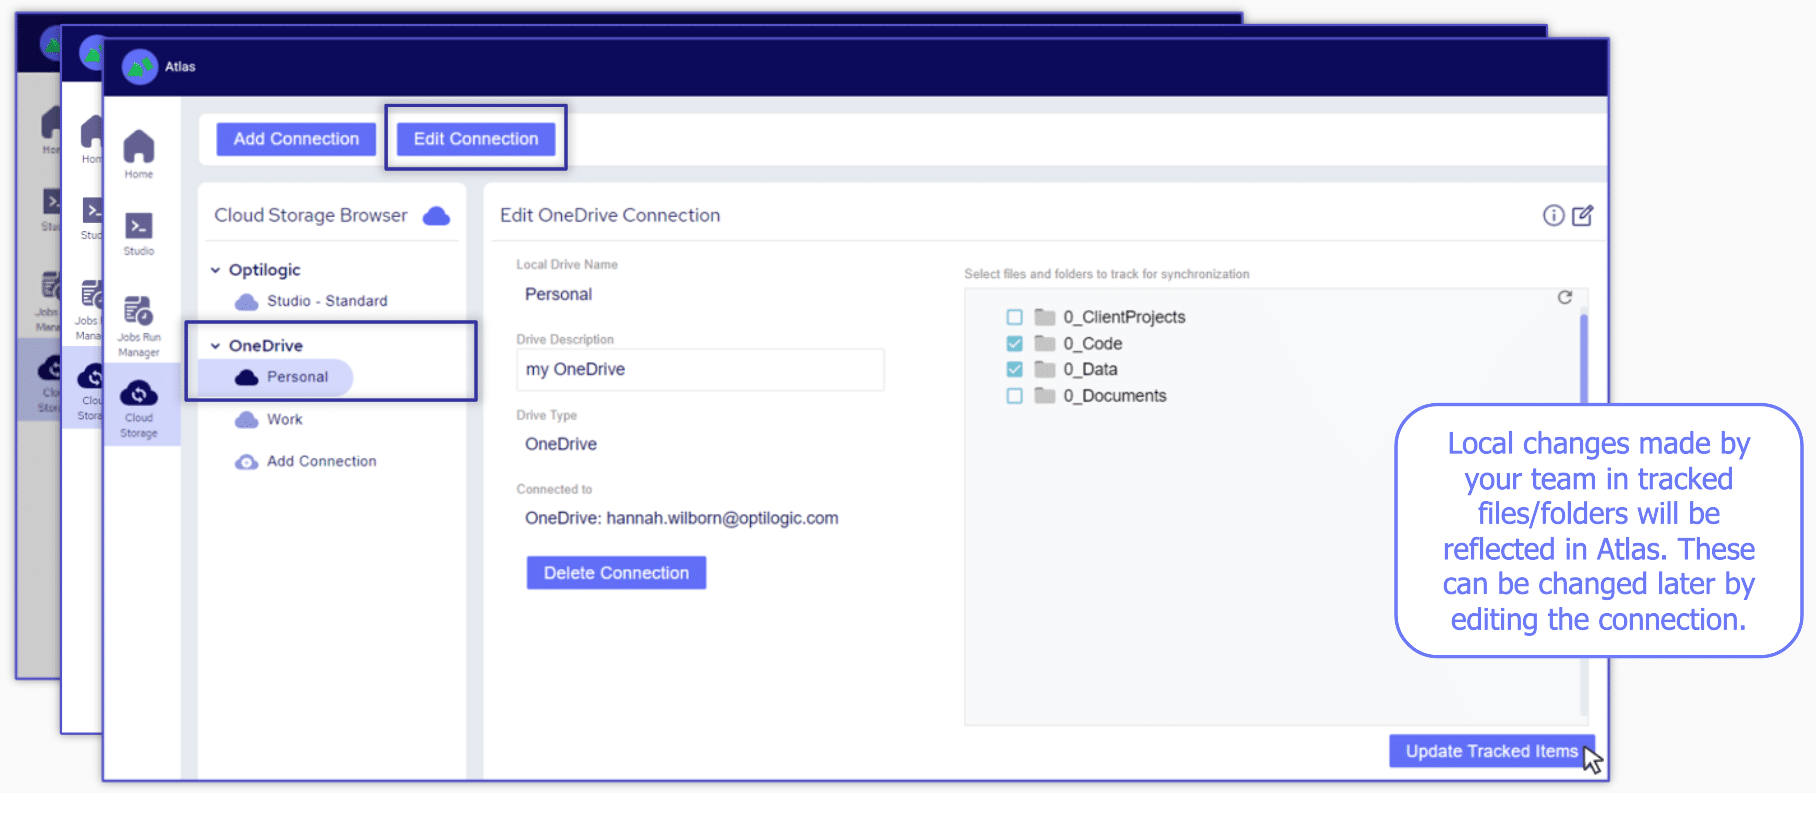
4. Leverage API code
Before you get started in Cosmic Frog watch this short video to learn how to navigate the software.
To help familiarize you with our product we have created the following video.